Description
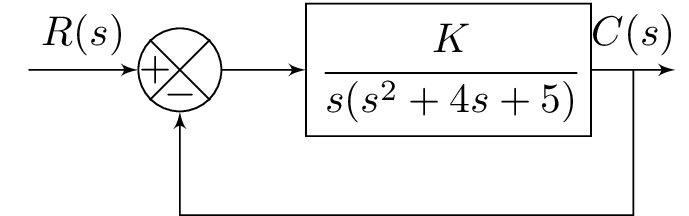
The code above is a LaTeX document that defines a TikZ picture environment to create a block diagram. It uses the "blox" package and "tikz" package to draw the blocks and arrows in the diagram. The block diagram represents a feedback control system with an input signal , a controller block with transfer function , and an output signal . The blocks are labeled with letters A, B, C, and E, and arrows are labeled with text to indicate the input and output signals. The "amsmath" and "amssymb" packages are also loaded to allow for mathematical notation in the diagram.
Keywords
Keywords: TikZ, blox, control systems, block diagram, transfer function.
Source Code
\documentclass{standalone}
\usepackage{amsmath}  % For math
\usepackage{amssymb}  % For more math

\usepackage{blox}
\usepackage{tikz}
\begin{document}
\begin{tikzpicture}
\bXInput{A}
\bXComp{B}{A}
\bXLink[$R(s)$]{A}{B}
\bXBloc[2]{C}{$\cfrac{K}{s(s^2+4s+5)}$}{B}
%\bXLink[$V_1$]{B}{C}
\bXLink{B}{C}
\bXOutput{E}{C}
\bXLink[$C(s)$]{C}{E}
\bXReturn{C-E}{B}{}
\end{tikzpicture}

\end{document}