Description
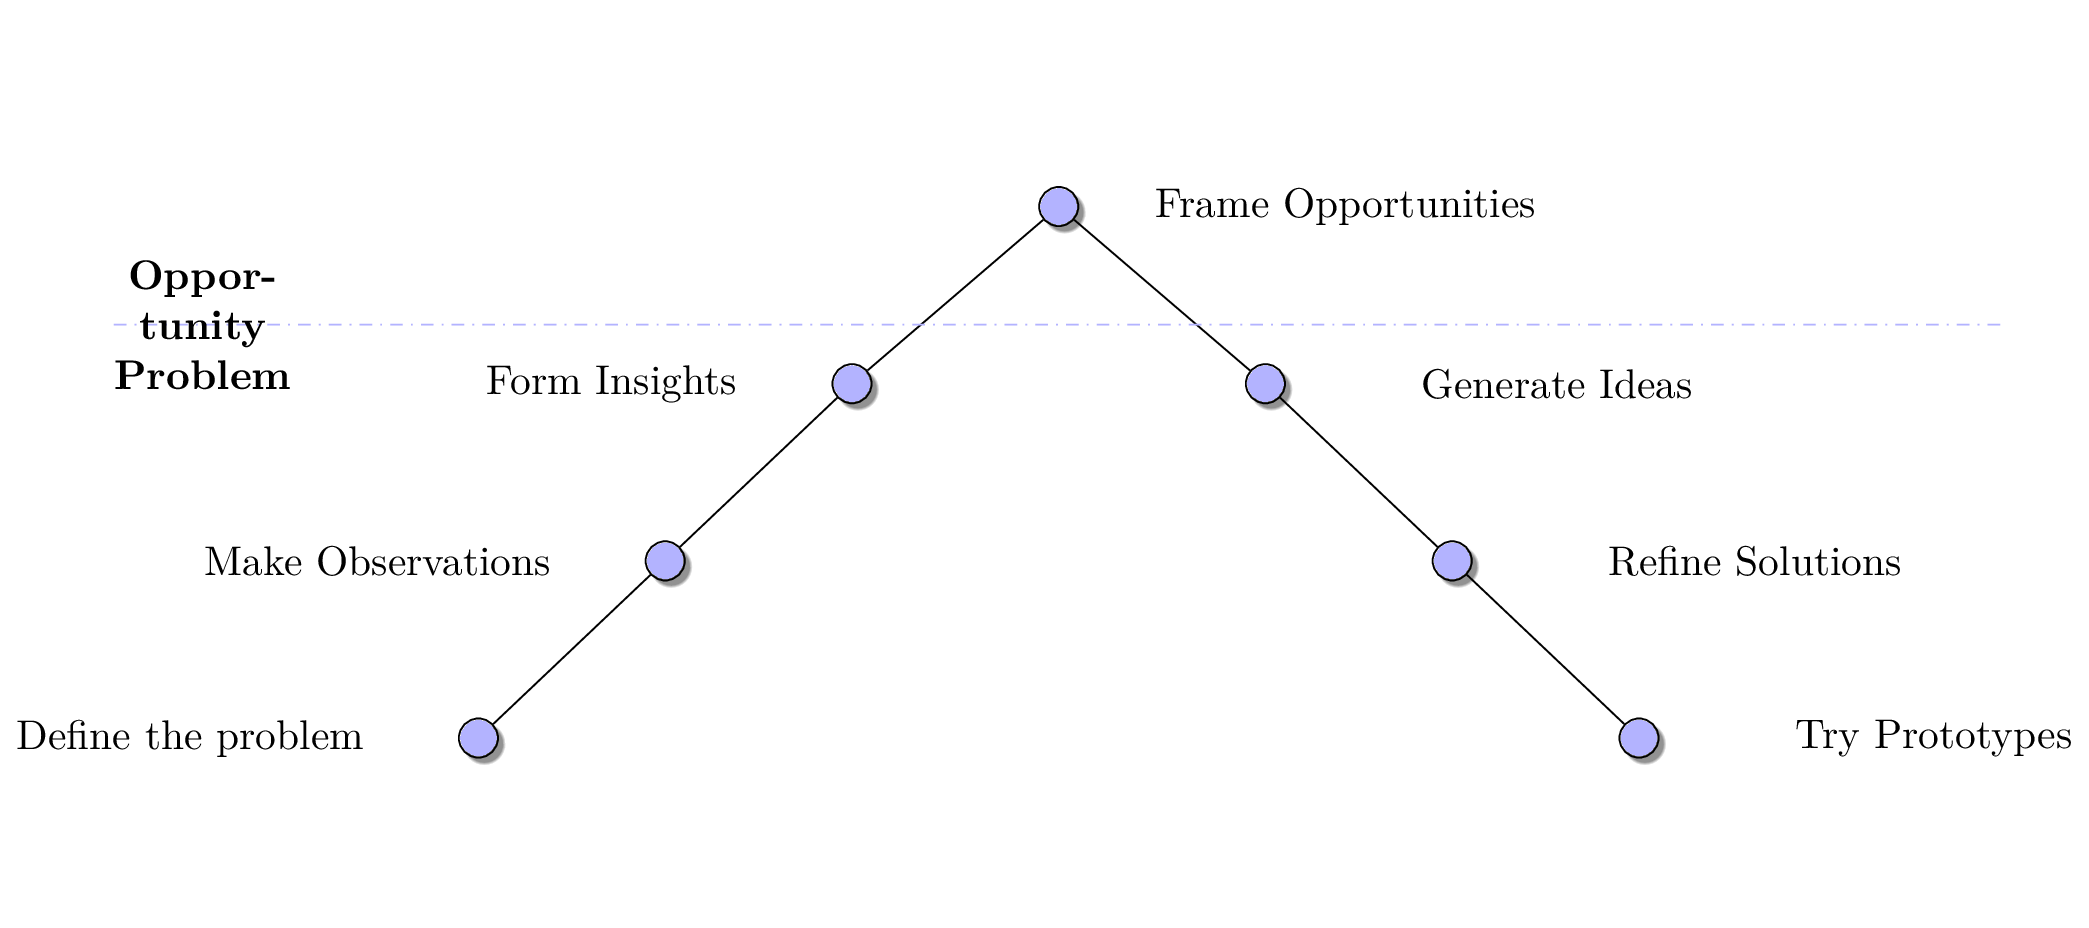
The given code is a LaTeX document that generates a flowchart using the TikZ package.
The document begins with the preamble, which sets the document class to standalone and loads the necessary TikZ libraries. The TikZ styles for each level of the flowchart are also defined here.
Next, the TikZ environment is created, and the every node style is set to a blue circle with a drop shadow. The no shadows style is defined to remove the shadow from labels in the flowchart.
The flowchart is then created using the node and child commands to define the nodes and their relationships. The label command is used to add labels to each node, and the xshift command is used to adjust the horizontal position of some of the nodes.
Finally, a hard-coded line is drawn using the draw command, and a label is added using the node command.
Keywords
tikz, trees, shadows, node, style, label, child, draw, dash dot.
Source Code

\documentclass[tikz,border=0]{standalone}
\usepackage{tikz}
\usetikzlibrary{trees}
\usetikzlibrary{shadows}
\begin{document}
\begin{tikzpicture}[level distance=1.5cm,
level 1/.style={sibling distance=3.5cm},
level 2/.style={sibling distance=1cm}]
\tikzstyle{every node}=[circle, draw, fill=blue!30]
% Preamble:
\tikzset{no shadows/.style={general shadow/.style=}}
every label/.append style = {
     label distance=1em,
     font=\scriptsize,
     every shadow/.style={opacity=0}, % <- add this
  }
\node (Root) [circular drop shadow, label={[label distance=0.5cm]0:Frame Opportunities}] {}
    child {
    node[circular drop shadow, label={[left, label distance=-1cm]0:Form Insights}] {}
    child {
        node[circular drop shadow, xshift=-4.5em, label={[left, label distance=-1cm]0:Make Observations}] {}
        child { node[circular drop shadow, xshift=-4.5em, label={[left, label distance=-1cm]0:Define the problem}] {} }
    }
}
child {
    node[circular drop shadow, label={[right, label distance=1cm]0:Generate Ideas}] {}
    child {
        node[circular drop shadow, xshift=4.5em, label={[right, label distance=1cm]0:Refine Solutions}] {}
        child { node[circular drop shadow, xshift=4.5em, label={[right, label distance=1cm]0:Try Prototypes}] {} }
    }
};

% Harcoded line
\draw [blue!30,dash dot] (-8,-1) -- (8,-1);
\node[draw=none, fill=none, text width= 2cm, align=center] at (-7.25, -1) {\textbf{Opportunity Problem}};
\end{tikzpicture}
\end{document}