Description
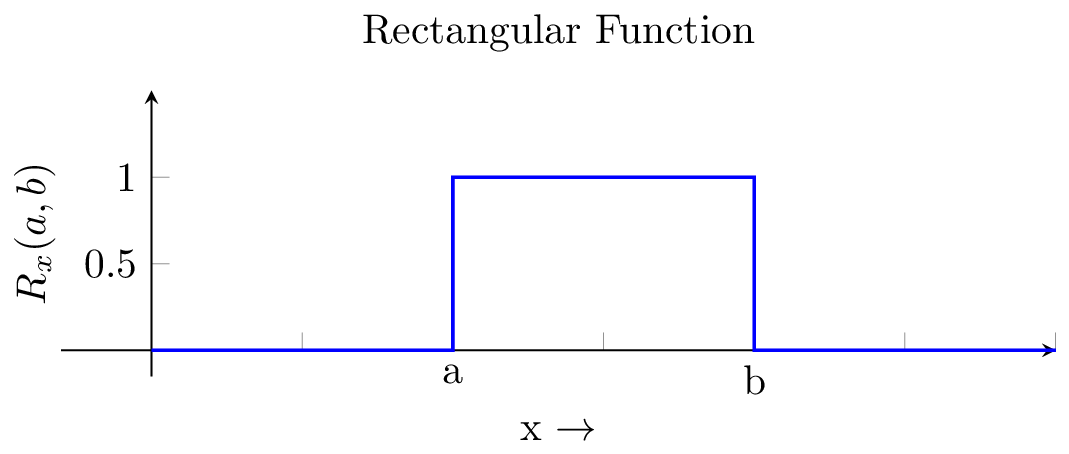
This code generates a plot of the rectangular function with given parameters a and b. It uses the standalone document class and loads the pgfplots package for plotting.
The plot is defined within the tikzpicture environment and is created using the axis environment with various options such as width, height, xticklabels, ymax, and xmax. The x and y axis lines are drawn using -stealth style and the title of the plot is set as "Rectangular Function".
The rectangular function is plotted using the \addplot command with the const plot option which connects the given coordinates with straight lines. The function is defined by a set of coordinates given as an argument to the command. The xlabel and ylabel are also defined and positioned near the ticks.
Keywords
pgfplots, tikzpicture, axis, rectangular function, plot, coordinates.
Source Code
\documentclass{standalone}
\usepackage{pgfplots}
\begin{document}
\begin{tikzpicture}
\begin{axis}[
width=10cm,
height=4cm,
x axis line style={-stealth},
y axis line style={-stealth},
title={Rectangular Function},
xticklabels={0,,,a,,b},
ymax = 1.5,xmax=3,
axis lines*=center,
ytick={0.5,1},
xlabel={x $\rightarrow$},
ylabel={$R_x(a,b)$},
xlabel near ticks,
ylabel near ticks]
\addplot+[thick,mark=none,const plot]
coordinates
{(0,0) (1,0) (1,1) (2,0) (3,0) (4,1) (5,0) (6,1) (7,0)};
\end{axis}
\end{tikzpicture}

\end{document}