Description
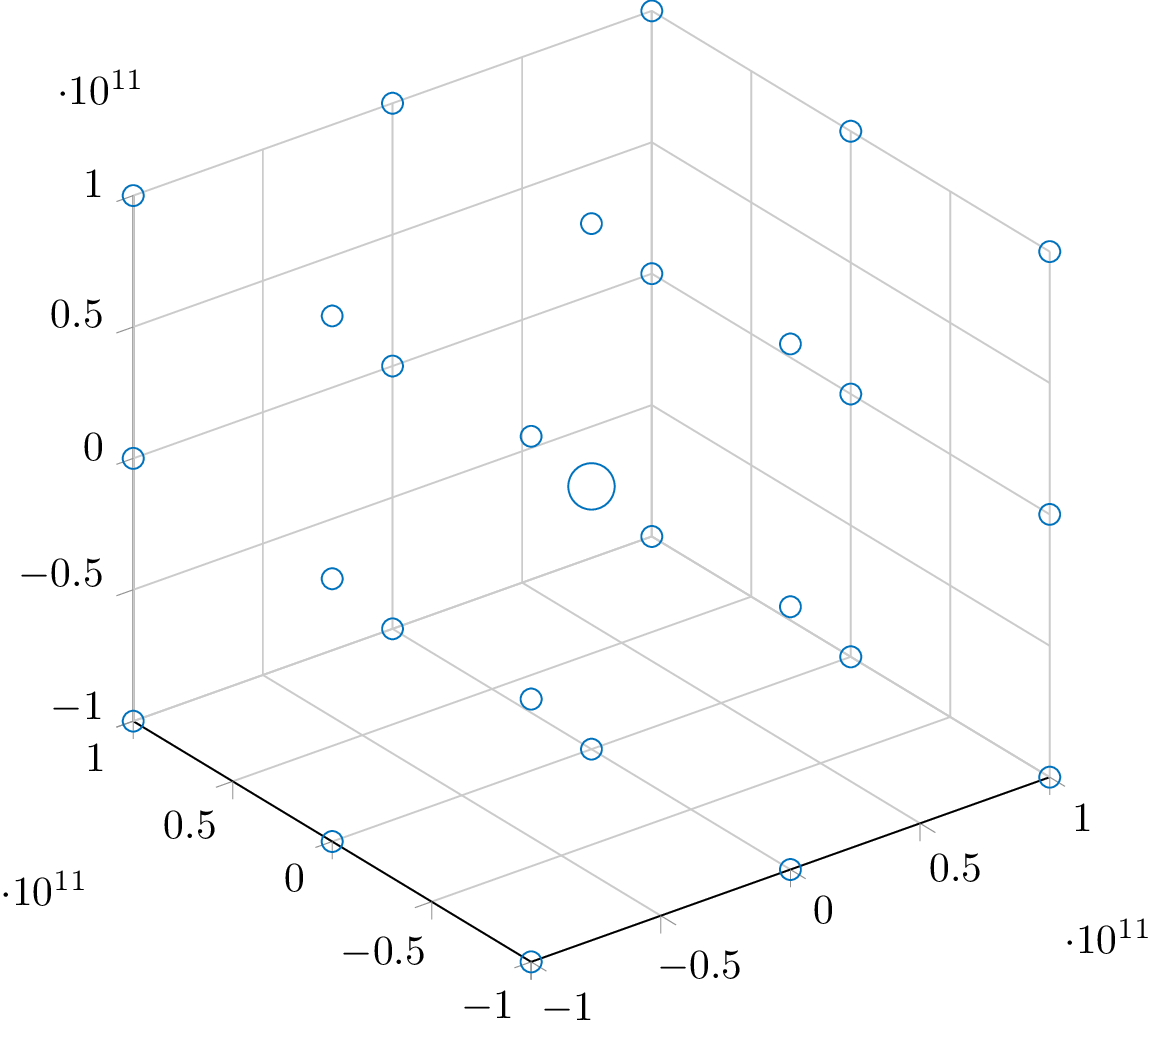
This code is a LaTeX document that generates a 3D scatter plot using the pgfplots package and tikzpicture environment. The plot displays a set of 27 points with varying sizes and colors, which are defined in a table format with four columns: x, y, z coordinates, and size. The axis environment sets the dimensions and properties of the plot, including the axis limits, grid lines, and legend. The mark option is used to specify the shape of the scatter plot marks (circles), while the color option sets the color of the marks using a pre-defined color mycolor1. The visualization depends on option specifies a variable perpointmarksize that is used to vary the size of the marks for each point, while the scatter/@pre marker code option appends a mark size style to the scatter plot marks. The resulting plot is saved as a PDF file.
Keywords
pgfplots, tikzpicture, axis, scatter, only marks, mark, color, visualization, table, row, size, mark size, scatter/use mapped color.
Source Code
\documentclass{standalone}

  \usepackage{pgfplots}
  \pgfplotsset{compat=newest}
  %% the following commands are needed for some matlab2tikz features
  \usetikzlibrary{plotmarks}
  \usetikzlibrary{arrows.meta}
  \usepgfplotslibrary{patchplots}
  \usepackage{grffile}
  \usepackage{amsmath}

  %% you may also want the following commands
  %\pgfplotsset{plot coordinates/math parser=false}
  %\newlength\figureheight
  %\newlength\figurewidth
\definecolor{mycolor1}{rgb}{0.00000,0.44700,0.74100}
\begin{document}
\begin{tikzpicture}

\begin{axis}[%
width=3.055in,
height=3.17in,
at={(0.524in,0.428in)},
scale only axis,
xmin=-100000000000,
xmax=100000000000,
tick align=outside,
ymin=-100000000000,
ymax=100000000000,
zmin=-100000000000,
zmax=100000000000,
view={-37.5}{30},
axis background/.style={fill=white},
axis x line*=bottom,
axis y line*=left,
axis z line*=left,
xmajorgrids,
ymajorgrids,
zmajorgrids,
legend style={at={(1.03,1)}, anchor=north west, legend cell align=left, align=left, draw=white!15!black}
]
\addplot3[scatter, only marks, mark=o, color=mycolor1, mark options={}, scatter/use mapped color=mycolor1, visualization depends on={\thisrow{size} \as \perpointmarksize}, scatter/@pre marker code/.append style={/tikz/mark size=\perpointmarksize}] table[row sep=crcr]{%
x	y	z	size\\
-100000000000	-100000000000	-100000000000	2.53722289127305\\
-100000000000	-100000000000	0	2.53722289127305\\
-100000000000	-100000000000	100000000000	2.51246890528022\\
-100000000000	0	-100000000000	2.52487623459052\\
-100000000000	0	0	2.52487623459052\\
-100000000000	0	100000000000	2.5\\
-100000000000	100000000000	-100000000000	2.51246890528022\\
-100000000000	100000000000	0	2.53722289127305\\
-100000000000	100000000000	100000000000	2.52487623459052\\
0	-100000000000	-100000000000	2.52487623459052\\
0	-100000000000	0	2.52487623459052\\
0	-100000000000	100000000000	2.51246890528022\\
0	0	-100000000000	2.51246890528022\\
0	0	0	5.59016994374947\\
0	0	100000000000	2.51246890528022\\
0	100000000000	-100000000000	2.51246890528022\\
0	100000000000	0	2.51246890528022\\
0	100000000000	100000000000	2.52487623459052\\
100000000000	-100000000000	-100000000000	2.52487623459052\\
100000000000	-100000000000	0	2.51246890528022\\
100000000000	-100000000000	100000000000	2.52487623459052\\
100000000000	0	-100000000000	2.53722289127305\\
100000000000	0	0	2.51246890528022\\
100000000000	0	100000000000	2.52487623459052\\
100000000000	100000000000	-100000000000	2.52487623459052\\
100000000000	100000000000	0	2.52487623459052\\
100000000000	100000000000	100000000000	2.51246890528022\\
};

\end{axis}
\end{tikzpicture}
\end{document}