Description
The code is a LaTeX document that uses the TikZ package to create a block diagram. It defines several styles for different types of nodes in the diagram, such as inputs, outputs, and blocks. It then creates the nodes and connects them with arrows to represent the flow of signals in the system.
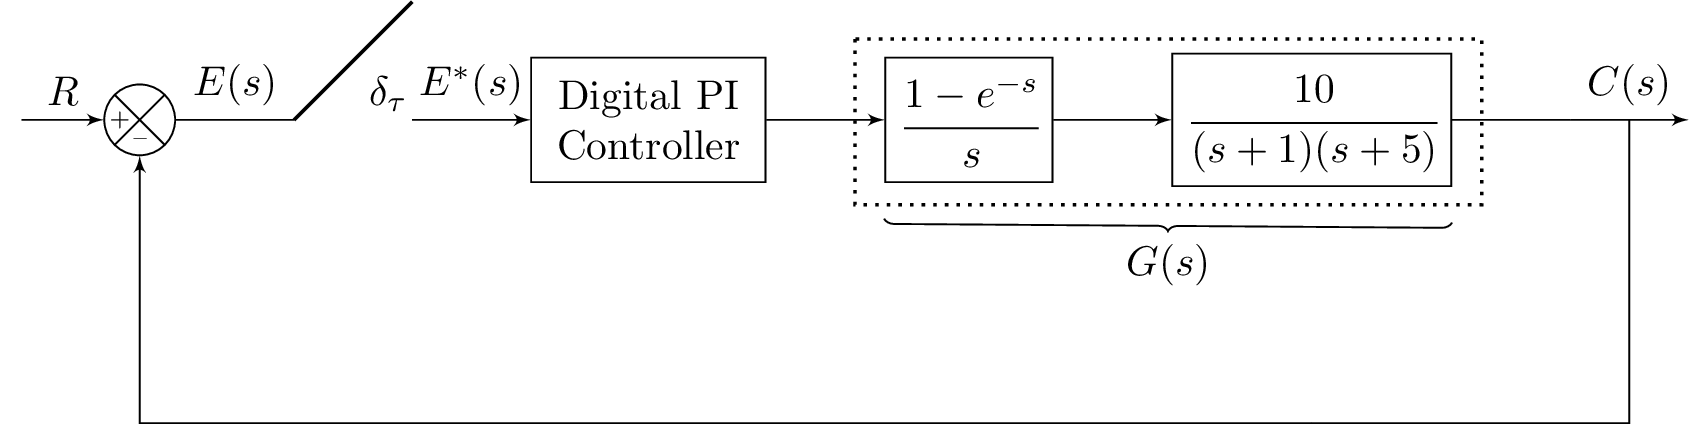
The diagram itself represents a control system with a digital PI controller, a zero-order hold (ZOH) block, and a plant block. The input to the system is labeled as R, and the output is labeled as C(s). The diagram also includes a feedback loop, with the output of the plant being fed back to the summing node where it is subtracted from the input R.
The code uses various TikZ library functions, such as positioning, shapes, arrows, and decorations. It also defines a custom style named "add" that creates a small cross symbol with labels on each arm, used to label the summing node in the diagram.
Keywords
tikz, graph, directed, edges, nodes, style, arrow, label, position, above, right, left, below, color, blue, red, dashed.
Source Code
\documentclass[
border={-25pt 0pt 0pt 0pt} % left bottom right top
]{standalone}
\usepackage{tikz}
\usepackage{amsmath}
\usetikzlibrary{positioning}
\usetikzlibrary{shapes,arrows,calc}
\usetikzlibrary{decorations.text}
\usetikzlibrary{decorations.pathreplacing}
\tikzset{add/.style n args={4}{
		minimum width=6mm,
		path picture={
			\draw[black]
			(path picture bounding box.south east) -- (path picture bounding box.north west)
			(path picture bounding box.south west) -- (path picture bounding box.north east);
			\node at ($(path picture bounding box.south)+(0,0.13)$)     {\tiny #1};
			\node at ($(path picture bounding box.west)+(0.13,0)$)      {\tiny #2};
			\node at ($(path picture bounding box.north)+(0,-0.13)$)        {\tiny #3};
			\node at ($(path picture bounding box.east)+(-0.13,0)$)     {\tiny #4};
		}
	}
}
\begin{document}

%\begin{figure}
%\centering
	%\tikzstyle{block} = [draw, fill=blue!20, rectangle, minimum height=3em, minimum width=4em]
	\tikzstyle{block} = [draw, rectangle, minimum height=3em, minimum width=4em]
	\tikzstyle{controller} = [draw, fill=red!20, rectangle, minimum height=3em, minimum width=4em]
	\tikzstyle{sum} = [draw, fill=blue!20, circle, node distance=1cm]
	\tikzstyle{input} = [coordinate]
	\tikzstyle{output} = [coordinate]
	\tikzstyle{sampleSP} = [coordinate]
	\tikzstyle{sampleEP} = [coordinate]
	\tikzstyle{otherPoint} = [coordinate]
	\tikzset{
		position label/.style={
			below = 3pt,
			text height = 1.5ex,
			text depth = 1ex
		},
		brace/.style={
			decoration={brace, mirror},
			decorate
		}
	}
	\begin{tikzpicture}[auto, >=latex']
	% Nodes
	\node [input] (input) {};
	%\node [sum, right = 1cm of input] (sum) {};
	\node[draw,circle,add={--}{+}{}{},right of= input](sum){};
	\node [sampleSP, right = 1cm of sum] (sumSP) {};
	\node [sampleEP, right = 1cm of sumSP] (sumEP) {};
	\node [sampleEP, above = 1cm of sumEP] (sumEPTOP) {};
	\node [block, right = 1cm of sumEP,text width=1.75cm,align=center] (systemK) {Digital PI Controller};
	\node [block, right = 1cm of systemK] (systemZOH) {$\cfrac{1-e^{-s}}{s}$};
	\node [block, right = 1cm of systemZOH] (system) {$\cfrac{10}{(s+1)(s+5)}$};
	\node [otherPoint,right = 1cm of system] (branchPoint) {};
	\node [otherPoint,below = 1 cm of system] (belowsystem) {}; %{$\frac{1}{Ts+1}$};
	%\node [block, right = 1cm of system] (system2) {$\frac{1}{Ts+1}$};
	\node [output, right = 1cm of branchPoint] (output) {};
	\node [input, below = 2cm of system] (m) {};

	% Arrows
	\draw [draw,->] (input) -- node {$R$} (sum);
	% Arrows for first sampler
	\draw [-] (sum) -- node {$E(s)$} (sumSP);
	\draw [-,thick] (sumEPTOP) -- node {$\delta_\tau$} (sumSP);
	\draw [->] (sumEP) -- node {$E^\ast(s)$} (systemK);
	\draw [->] (systemK) -- node {} (systemZOH);
	\draw [->] (systemZOH) -- node {} (system);
	%\draw [->] (sumEP) -- node {$M^\ast(s)$} (systemH);
	% \draw [->] (system) --  (system2);
	\draw [-] (system) --  (branchPoint);
	\draw [->] (branchPoint) -- node (y) {$C(s)$}(output);

	\draw [-] (y) |- (m) {} ;
	\draw [->] (m) -| (sum); %{$-$}  node [near end] {} (sum);
	%\node [below = 0.005 cm of system] (PointHeader) {\scriptsize{$G(s)$}};
	\draw[thick,dotted]     ($(systemZOH.north west)+(-0.25,0.15)$) rectangle ($(system.south east)+(0.25,-0.15)$);
	\draw [brace,decoration={raise=2ex}] (systemZOH.south west) -- node [position label,yshift=-2ex] {$G(s)$} (system.south east);
	\end{tikzpicture}
%\end{figure}
\end{document}