Description
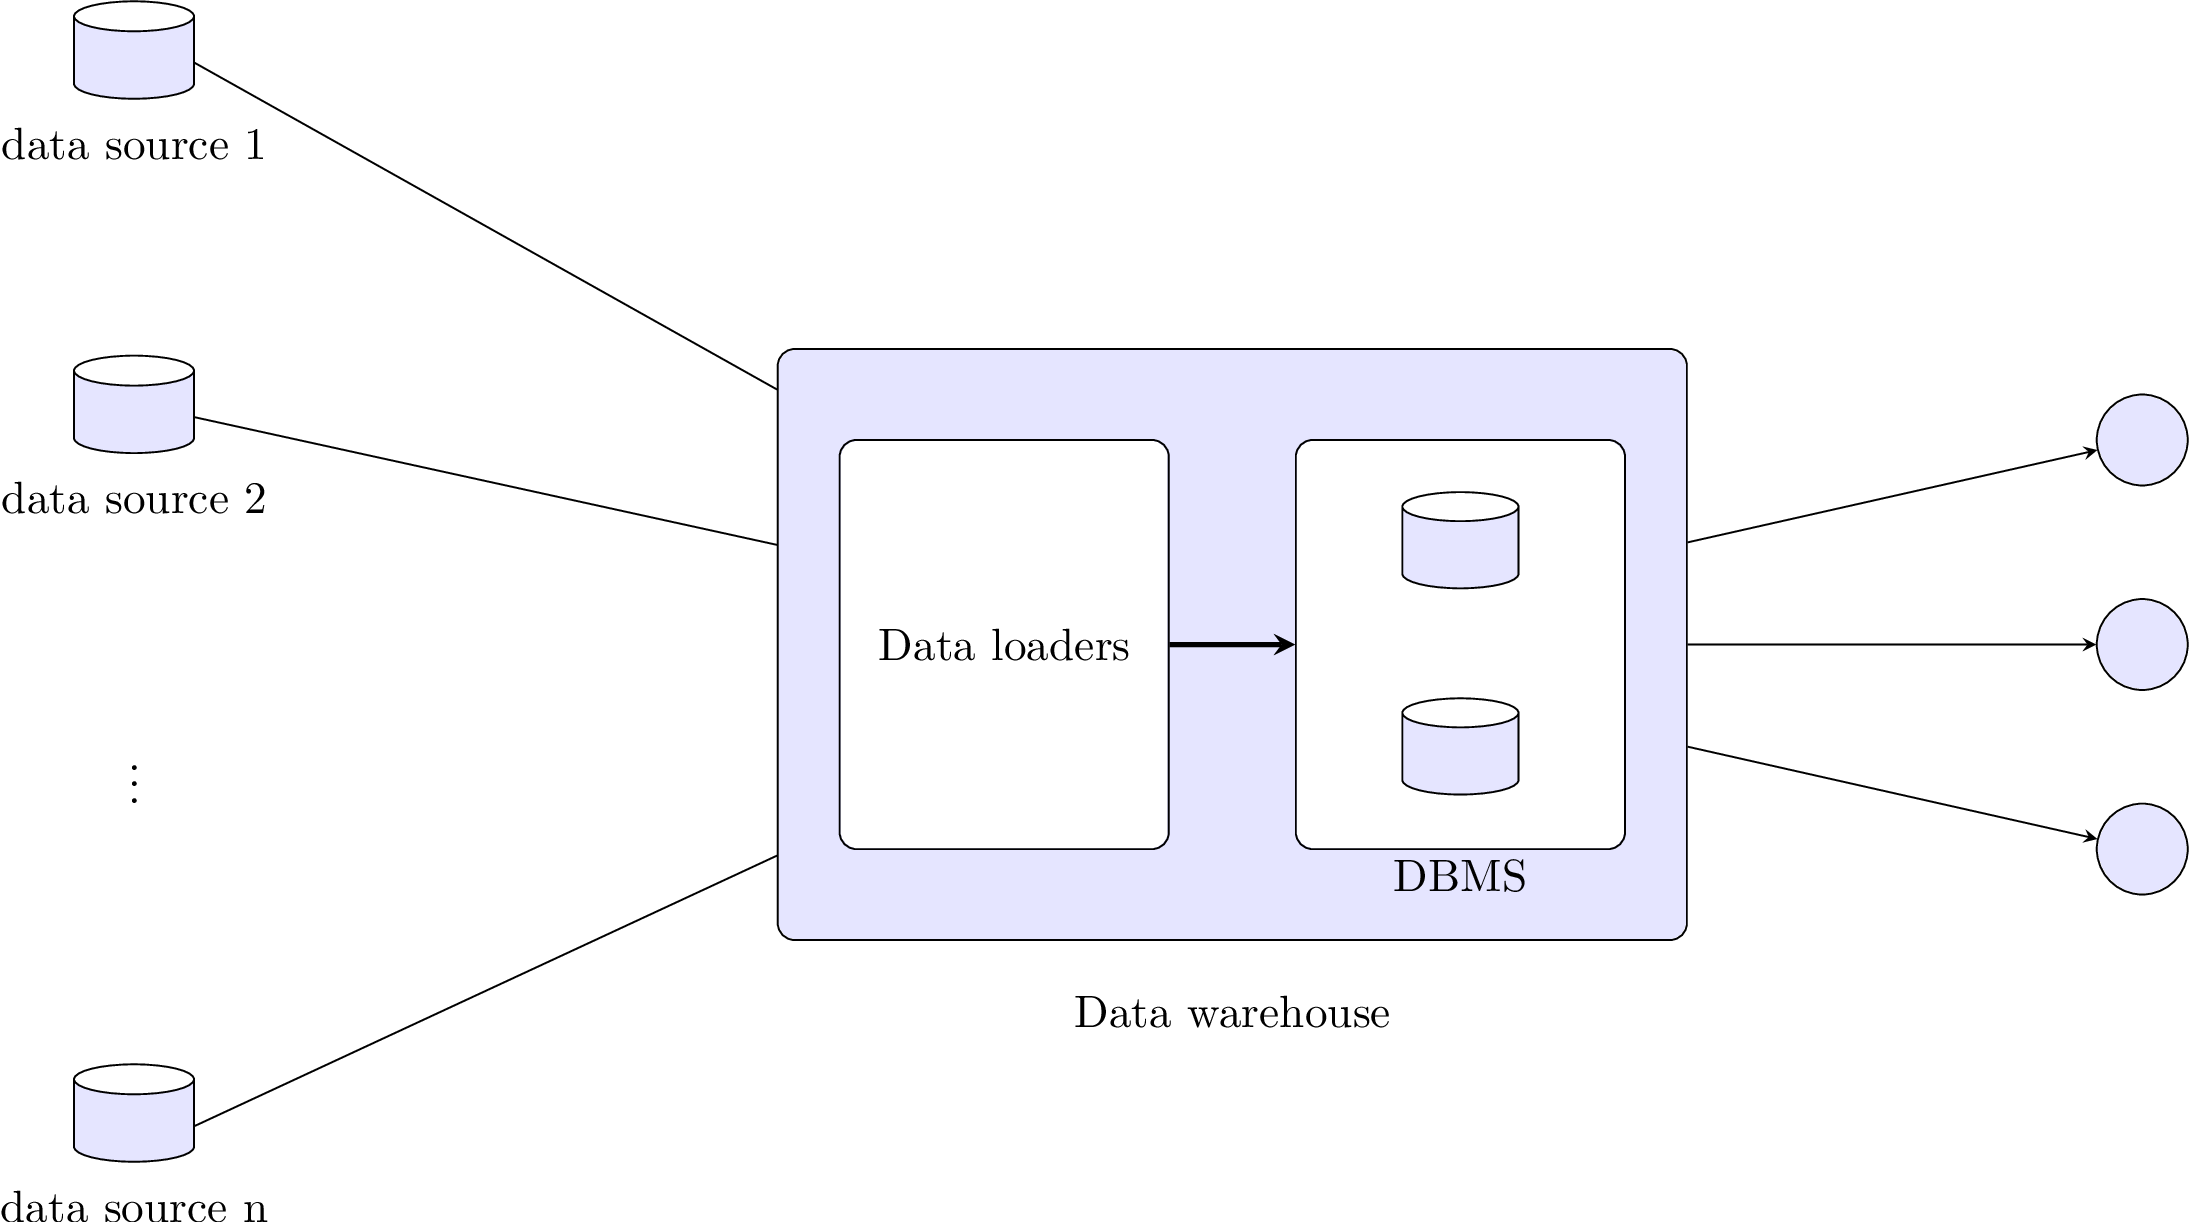
The code is a LaTeX document that generates a diagram using the TikZ package. The diagram represents a data warehousing system, with several data sources represented as cylinders labeled as "DB1", "DB2", "DB3", etc., and a data warehouse represented as a rounded rectangle labeled as "Data warehouse". The data sources are connected to the data warehouse using arrows, and there are three circles labeled as "c1", "c2", and "c3" that are also connected to the data warehouse using arrows. The diagram also contains two smaller rectangles labeled as "Data loaders" and "DBMS" that are connected to each other using a very thick arrow. The diagram uses various TikZ options such as node distance, cylinder, text opacity, rounded corners, aspect, minimum height, minimum width, fill, and draw to create the various shapes and styles of the elements in the diagram.
Keywords
latex, tikz, shapes, positioning, database, cylinder, arrow, node, label, theme, box, circle, draw, fill.
Source Code
\documentclass[11pt]{standalone}
\usepackage[T1]{fontenc}
\usepackage{tikz}
\usetikzlibrary{calc,positioning,shapes.geometric}

\begin{document}
  \begin{tikzpicture}[
    >=stealth,
    node distance=1.5cm,
    database/.style={
      cylinder,
      text opacity=0,
      cylinder uses custom fill,
      cylinder body fill=blue!10,
      cylinder end fill=white!50,
      shape border rotate=90,
      aspect=0.25,
      draw
    }
  ]
    \node[database, label={[anchor=north, inner sep=0pt, yshift=-0.6em, text=black]south:data source 1}] (db1) at (0,0) {DB1};
    \node[database, label={[anchor=north, inner sep=0pt, yshift=-0.6em, text=black]south:data source 2}, below of=db1] (db2) {DB2};
    \node[below of=db2] (dbDots) {$\vdots$};
    \node[database, label={[anchor=north, inner sep=0pt, yshift=-0.6em, text=black]south:data source n}, below of=dbDots] (db3) {DB3};

    % THEME BLOCK
    \node[rounded corners, %fill=black,
    text depth = 5em,
    draw,
    % double distance =1pt,    %% here
    %font=\Large,
    minimum height= 13em,
    minimum width= 20em,
    fill=blue!10,
    label={[anchor=north, inner sep=0pt, yshift=-1em] south:{Data warehouse}}] at ([xshift=25.5em, yshift=-2em]
    db2.west) (dw){};

    % Configuration Files and Plugin box
    \node[rounded corners, %fill=black,
    draw,
    text centered,
    text width = 0.20\textwidth,
    fill=white,
    minimum height= 9em,
    minimum width= 2em] at ([xshift=5em] dw.west) (dl){Data loaders};
    \node[rounded corners, %fill=black,
    draw,
    text centered,
    text width = 0.20\textwidth,
    fill=white,
    minimum height= 9em,
    minimum width= 2em,
    label={[anchor=north, inner sep=0pt, yshift=-0.2em] south:{DBMS}}] at ([xshift=-5em] dw.east) (dbms){};
    \node[database] at ([yshift=-2.5em] dbms.north) {din1};
    \node[database] at ([yshift= 2em] dbms.south) {din2};


    \node[circle, fill=blue!10, draw, minimum width=2em] at ([xshift=10em] dw.east) (c2) {};
    \node[circle, fill=blue!10, draw, minimum width=2em] at ([yshift=4.5em, xshift=10em] dw.east) (c1) {};
    \node[circle, fill=blue!10, draw, minimum width=2em] at ([yshift=-4.5em, xshift=10em] dw.east) (c3) {};

    % arrows

    \draw (db1.east) -- (dw);
    \draw (db2.east) -- (dw);
    \draw (db3.east) -- (dw);
    \draw[->] (dw) -> (c1);
    \draw[->] (dw) -> (c2);
    \draw[->] (dw) -> (c3);

    % Extra Thick arrow
    \draw[->, very thick] (dl) -> (dbms);
  \end{tikzpicture}
\end{document}