Description
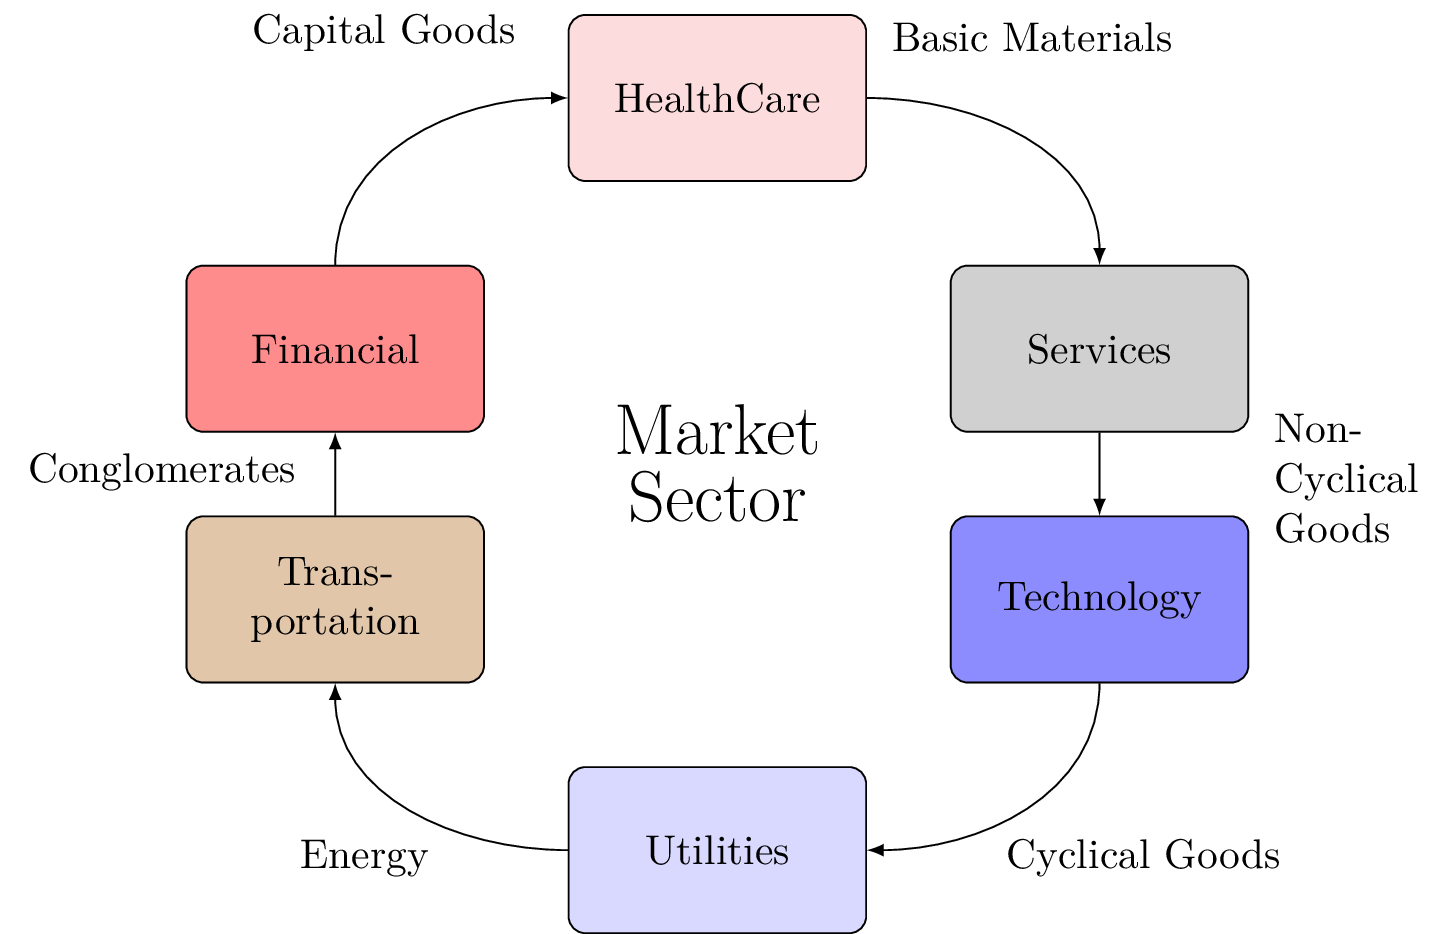
This is a LaTeX code that generates a standalone flowchart diagram using the TikZ package. The diagram depicts a market sector classification, with six nodes representing different sectors of the market. The sectors are Healthcare, Services, Technology, Utilities, Transportation, and Financial, and they are represented by rectangular blocks with rounded corners. The blocks are connected by lines that indicate the relationship between the sectors, with arrows pointing from one block to another. The diagram also has labels for the different sectors of the market, which are positioned outside the blocks. The code uses various styles and properties to define the appearance of the nodes, lines, and labels, such as node distance, text width, fill color, line style, and font size.
Keywords
latex, tikz, shapes, arrows, positioning, nodes, rectangle, draw, style, fill, line, east, west, out, in, north, south, above, below, label, text, width, align, center, Conglomerates, Basic Materials, Capital Goods, Cyclical Goods, Non-Cyclical Goods, Energy, Financial, HealthCare, Services, Technology, Transportation, Utilities.
Source Code
% Inspired by Learn Algorithmic Trading by Sebastien Donadio Packt on page 10
\documentclass{standalone}
\usepackage{tikz}
\usepackage{xcolor}
\usetikzlibrary{shapes, arrows.meta, positioning}

\begin{document}
    \pagestyle{empty}

    \begin{tikzpicture}[
        node distance=2em and 2em,
        block/.style={rectangle, draw,
    text width=6.5em, text centered, rounded corners, minimum height=4em},
        line/.style={draw, -latex},
        ]

        \node [block, fill=gray!15!red!15] (hc) {HealthCare};
        \node [block, fill=gray!45, below right= of hc] (serv) {Services};
        \node [block, fill=blue!45, below = of serv] (tech) {Technology};
        \node [block,fill=blue!15, below left= of tech] (util) {Utilities};
        \node [block,fill=brown!45, above left= of util] (trans) {Transportation};
        \node [block, fill=red!45, above = of trans] (fin) {Financial};
        % Connections
        \path [line] (hc.east) to[out=0, in=90] (serv.north);
        \path [line] (serv.south) -- (tech);
        \path [line] (tech.south) to[out=-90, in=0] (util.east);
        \path [line] (util.west) to[out=180, in=-90] (trans.south);
         \path [line] (trans.north) -- (fin);
        \path [line] (fin.north) to[out=90, in=180] (hc.west);

        % Market Sectors label
        \node [draw=none, below = 5em of hc, text width = 2cm, align = center] (label) {\LARGE Market \\[1mm] Sector};

        \node [above left = -3em and 3em of util] () {Energy};
        \node [above right = -3em and 3em of util] () {Cyclical Goods};
        \node [above right = -1em and 0.25em of tech, text width = 3.5em] () {Non-Cyclical Goods};
        \node [above right = -1.25em and 0.25em of hc, text width = 7em] () {Basic Materials};
        \node [above left = -1.25em and 0.25em of hc, text width = 7em] () {Capital Goods};
        \node [above left = 0.25em and -3em of trans] () {Conglomerates};
    \end{tikzpicture}
\end{document}