Description
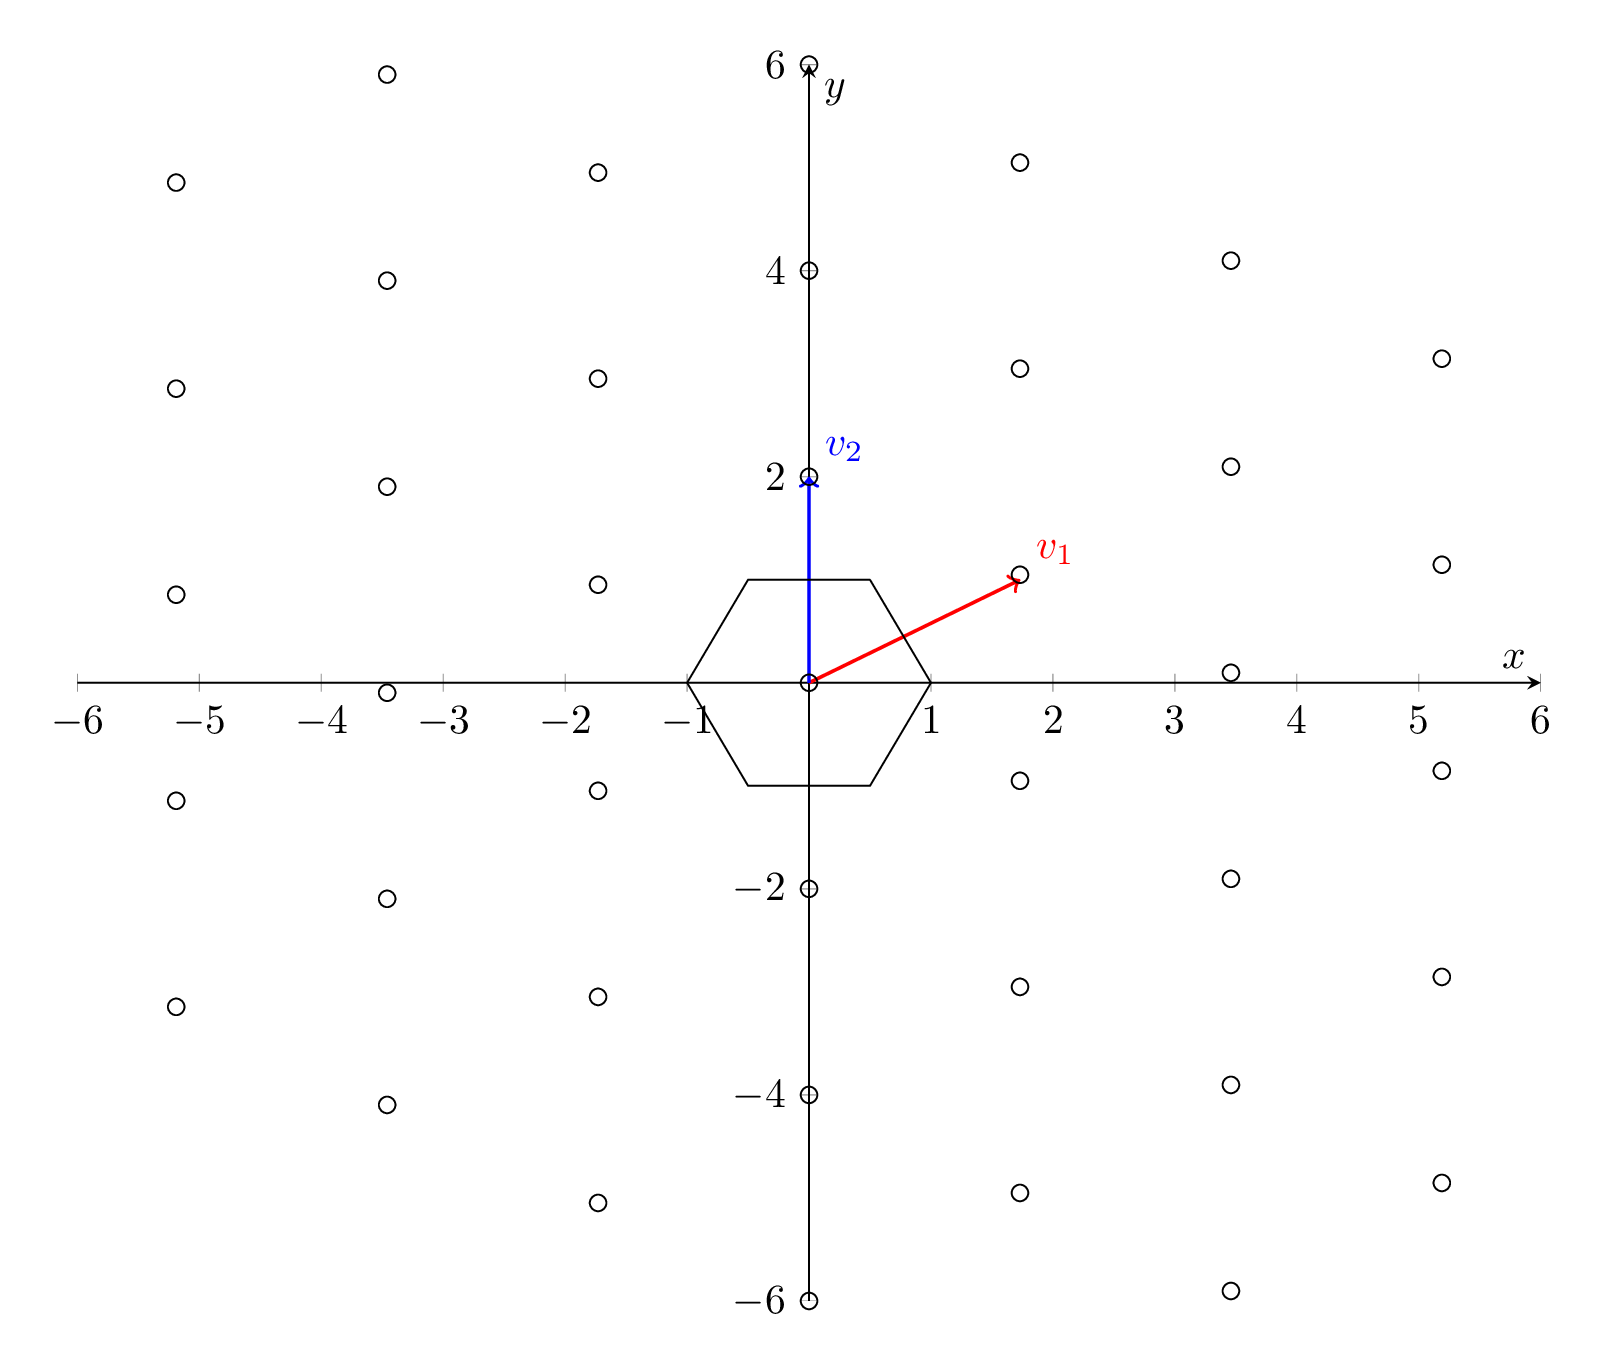
This code generates a TikZ plot with a 2D coordinate system using the pgfplots package. The plot shows two vectors, v1 and v2, starting at the origin, and a regular polygon with six vertices centered at the origin. The plot also has several horizontal lines with markers at specific x-coordinates.
The plot is generated inside a tikzpicture environment, and the coordinate system is defined using the axis environment. The options specified for this environment include the axis lines, x-axis and y-axis limits, and labels for the x and y axes.
Two vectors, v1 and v2, are then plotted using the addplot function. The coordinates for each vector are specified using the coordinates function, and the vectors are labeled using the node function.
The polygon is plotted using the addplot function and the table function, with coordinates for the polygon vertices specified in the table.
Finally, several horizontal lines are plotted using the addplot function, with markers at specific x-coordinates specified using the pgfplotsinvokeforeach function. The markers are circular dots and the x-coordinates are specified using a list of values generated by the function.
Keywords
This code generates a TikZ plot with a 2D coordinate system using the pgfplots package. The plot shows two vectors, v1 and v2, starting at the origin, and a regular polygon with six vertices centered at the origin. The plot also has several horizontal lines with markers at specific x-coordinates.
The plot is generated inside a tikzpicture environment, and the coordinate system is defined using the axis environment. The options specified for this environment include the axis lines, x-axis and y-axis limits, and labels for the x and y axes.
Two vectors, v1 and v2, are then plotted using the addplot function. The coordinates for each vector are specified using the coordinates function, and the vectors are labeled using the node function.
The polygon is plotted using the addplot function and the table function, with coordinates for the polygon vertices specified in the table.
Finally, several horizontal lines are plotted using the addplot function, with markers at specific x-coordinates specified using the pgfplotsinvokeforeach function. The markers are circular dots and the x-coordinates are specified using a list of values generated by the function.
Source Code
\documentclass[tikz,border=3.14mm]{standalone}
\usepackage{pgfplots}
\pgfplotsset{compat=1.16}
\pgfplotsset{width=5.5in,compat=1.10}
\begin{document}
  \begin{tikzpicture}
  \begin{axis}[axis lines=middle,
  xmin=-6, xmax=6,
        ymin=-6,ymax=6,
                xlabel = $x$,
                ylabel = $y$]
\addplot [->, thick,  red]
        coordinates { (0,0) (sqrt(3),1)} node[above right,pos=1] {$v_1$};
\addplot [->, thick,  blue]
        coordinates { (0,0) (0,2)} node[above right,pos=1] {$v_2$};

\addplot+ [mark=none,black] table {
0.5 1
-0.5 1
-1 0
-0.5 -1
0.5 -1
1 0
0.5 1
};
\pgfplotsinvokeforeach{-6,-4,...,6}{
\addplot[only marks, mark=o, samples
at={-5.19,-3.46,-1.73,0,1.73,3.46,5.19}]{-0.55*x + #1};}
\end{axis}
\end{tikzpicture}
\end{document}