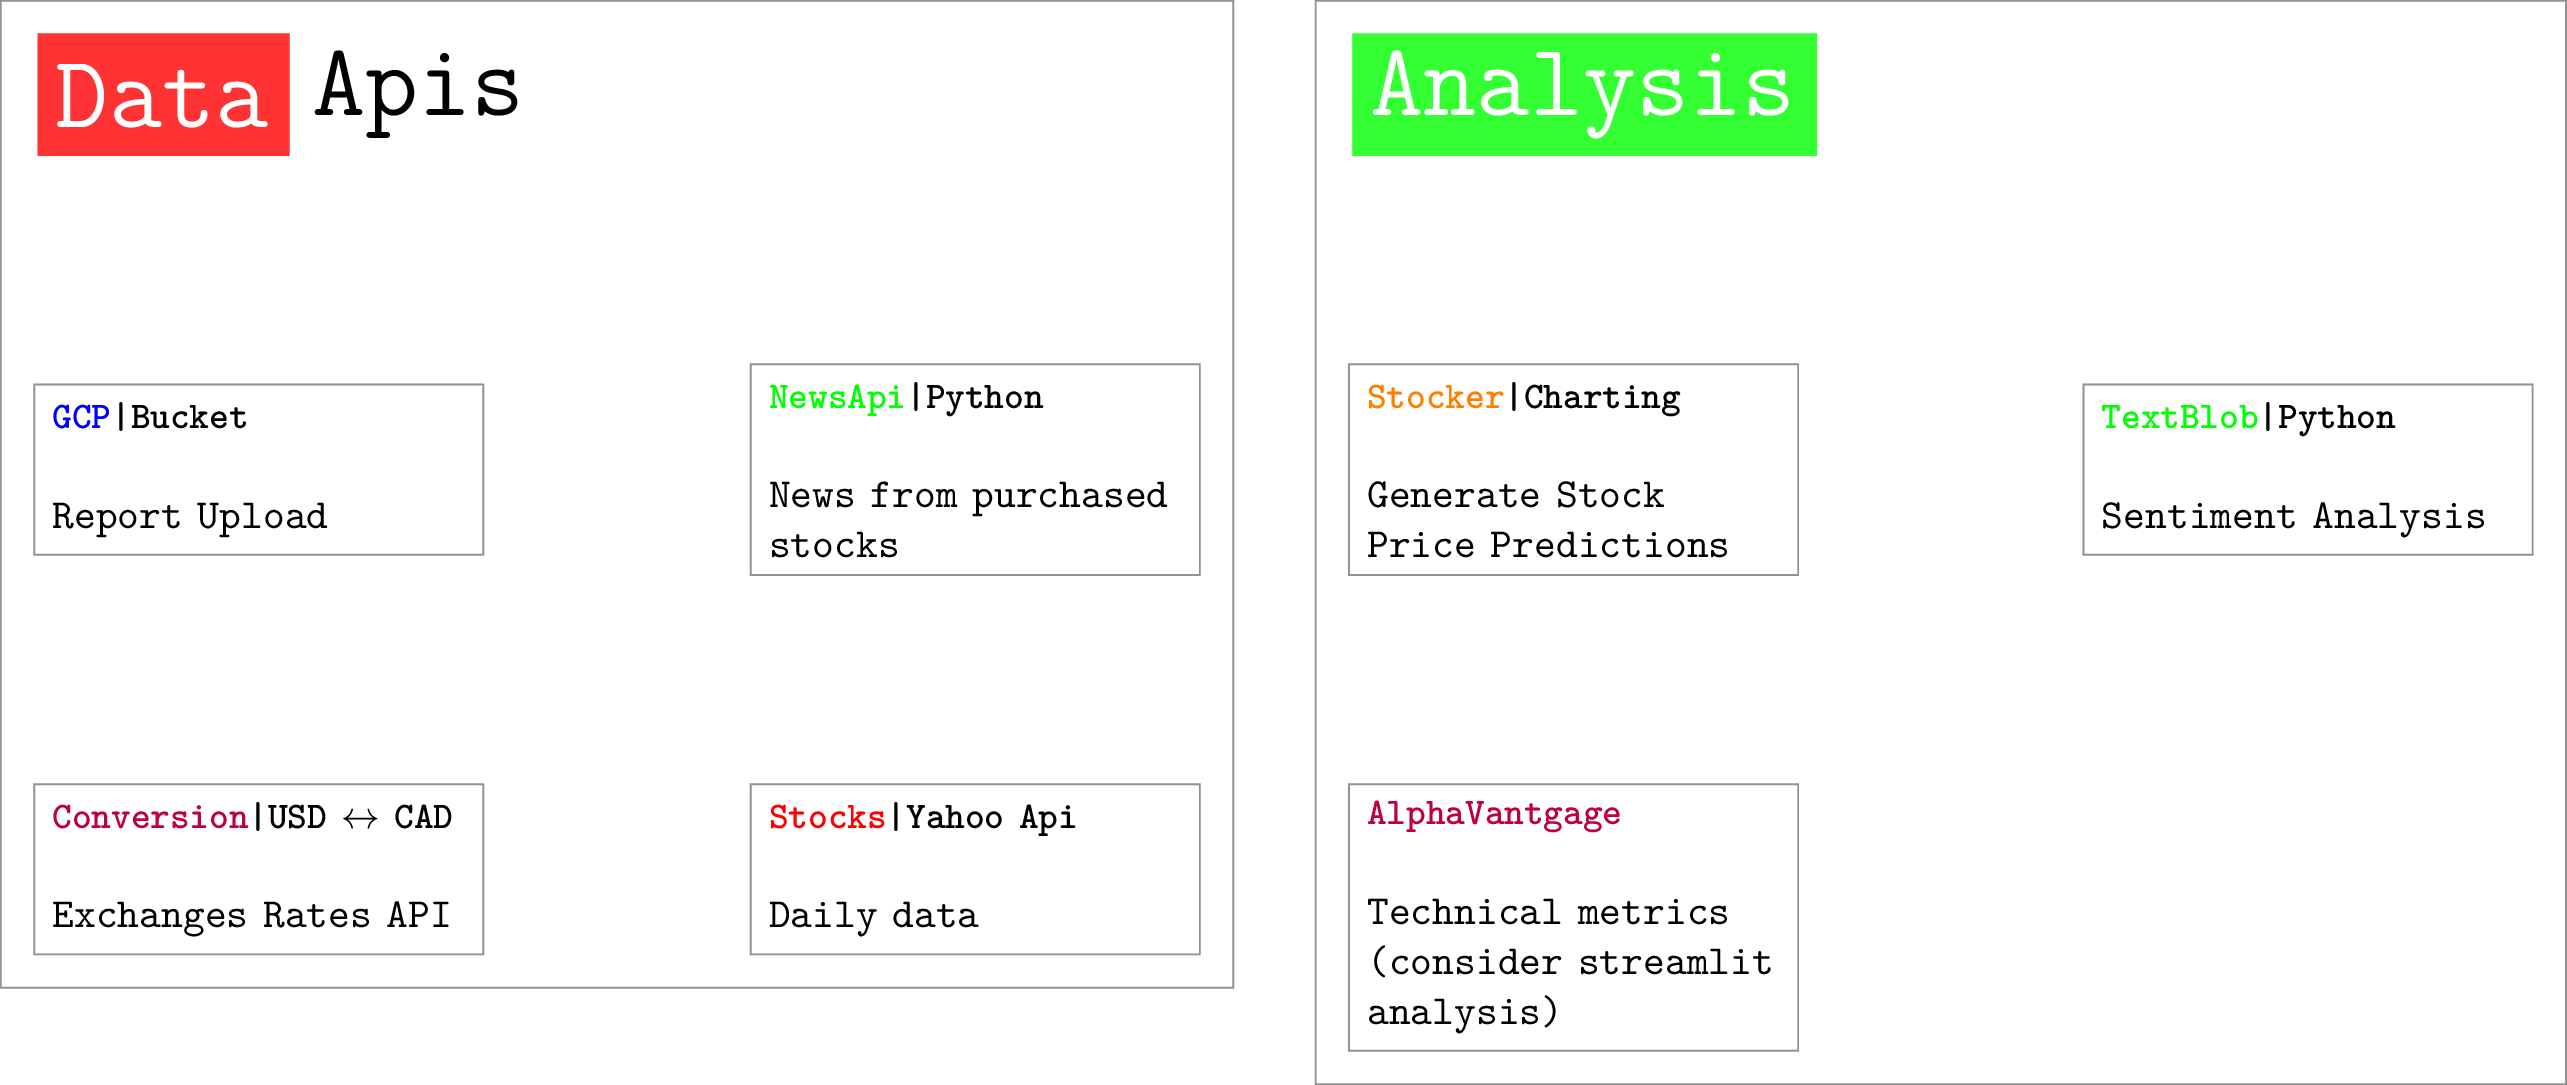
Description
This is a LaTeX code that generates a diagram using the TikZ package. The diagram consists of two rectangular modules, each containing four nodes. The first module is labeled "Data APIs" and has four nodes representing different APIs for obtaining data related to news, stocks, and exchange rates. The second module is labeled "Analysis" and has three nodes representing tools for analyzing the obtained data, including sentiment analysis, technical metrics, and generating stock price predictions. The diagram is generated using matrix nodes, and the style of each node is defined using the TikZ "draw" and "text width" commands. The overall style of the diagram is defined using the "tikzset" command, which includes the definition of the "moduleheader" style for the rectangular headers of each module.
Keywords
tikz, shapes, lato, fontenc, matrix, positioning, fit, rectangle, split, parts, draw, gray, inner, sep, anchor, west, color, white, blue, green, purple, yellow, orange, stock, module, header, node, title.
Source Code

% This is an original Diagram
% License: CC0 or do whatever you want
% Inspired by diagrams encountered at work, probably not illegal
\documentclass{standalone}
\usepackage{tikz}
\usetikzlibrary{shapes.multipart}
\usepackage[default]{lato}
\usepackage[T1]{fontenc}
\usetikzlibrary{matrix, positioning, fit}
\tikzset{
    moduleheader/.style args = {#1}{
       rectangle split, rectangle split horizontal, rectangle split parts=2,
       draw=none,
       thick,
       line width=2,
    rectangle split part fill={#1,white}% end of the append after command
    }% end of the box style definition
}
\begin{document}
\begin{tikzpicture}[font=\ttfamily,
  mymodule/.style={matrix of nodes, nodes=typetag, row sep=5em, column sep=5em},
  mycontainer/.style={draw=gray, inner sep=1ex},
  typetag/.style={draw=gray, inner sep=1ex, anchor=west},
  title/.style={draw=none, color=gray, inner sep=0pt}
  ]
  \matrix[mymodule] (mx1) {
    \node [moduleheader=red!80] (d1)
       { \nodepart[color=white]{one} {\Huge Data}\nodepart{two} {\Huge Apis}}; &  \\
    \node[draw, text width=3.5cm] (gcp) {
       \textbf{\small \textcolor{blue}{GCP}|Bucket} \newline
       \newline
       Report Upload
    }; &
    \node[draw, text width=3.5cm] (newsapi) {
       \textbf{\small \textcolor{green}{NewsApi}|Python} \newline
       \newline
       News from purchased stocks
    };\\
    \node[draw, text width=3.5cm] (yahoo) {
       \textbf{\small \textcolor{purple}{Conversion}|USD $\leftrightarrow$ CAD} \newline
       \newline
       Exchanges Rates API
    }; &
    \node[draw, text width=3.5cm] (test) {
       \textbf{\small \textcolor{red}{Stocks}|Yahoo Api} \newline
       \newline
       Daily data
    }; \\
  };
  \matrix[mymodule, right=of mx1.north east, matrix anchor=north west] (mx2) {
    \node [moduleheader=green!80] (d2)
       { \nodepart[color=white]{one} {\Huge Analysis}\nodepart{two} {}}; &  \\
    \node[draw, text width=3.5cm] (gcp) {
       \textbf{\small \textcolor{orange}{Stocker}|Charting} \newline
       \newline
       Generate Stock Price Predictions
    }; &
    \node[draw, text width=3.5cm] (newsapi) {
       \textbf{\small \textcolor{green}{TextBlob}|Python} \newline
       \newline
       Sentiment Analysis
    };\\
    \node[draw, text width=3.5cm] (yahoo) {
       \textbf{\small \textcolor{purple}{AlphaVantgage}} \newline
       \newline
       Technical metrics (consider streamlit analysis)
    }; &
     \\
  };
  \node[mycontainer, fit=(mx1)] {};
  \node[mycontainer, fit=(mx2)] {};

\end{tikzpicture}
\end{document}