Description
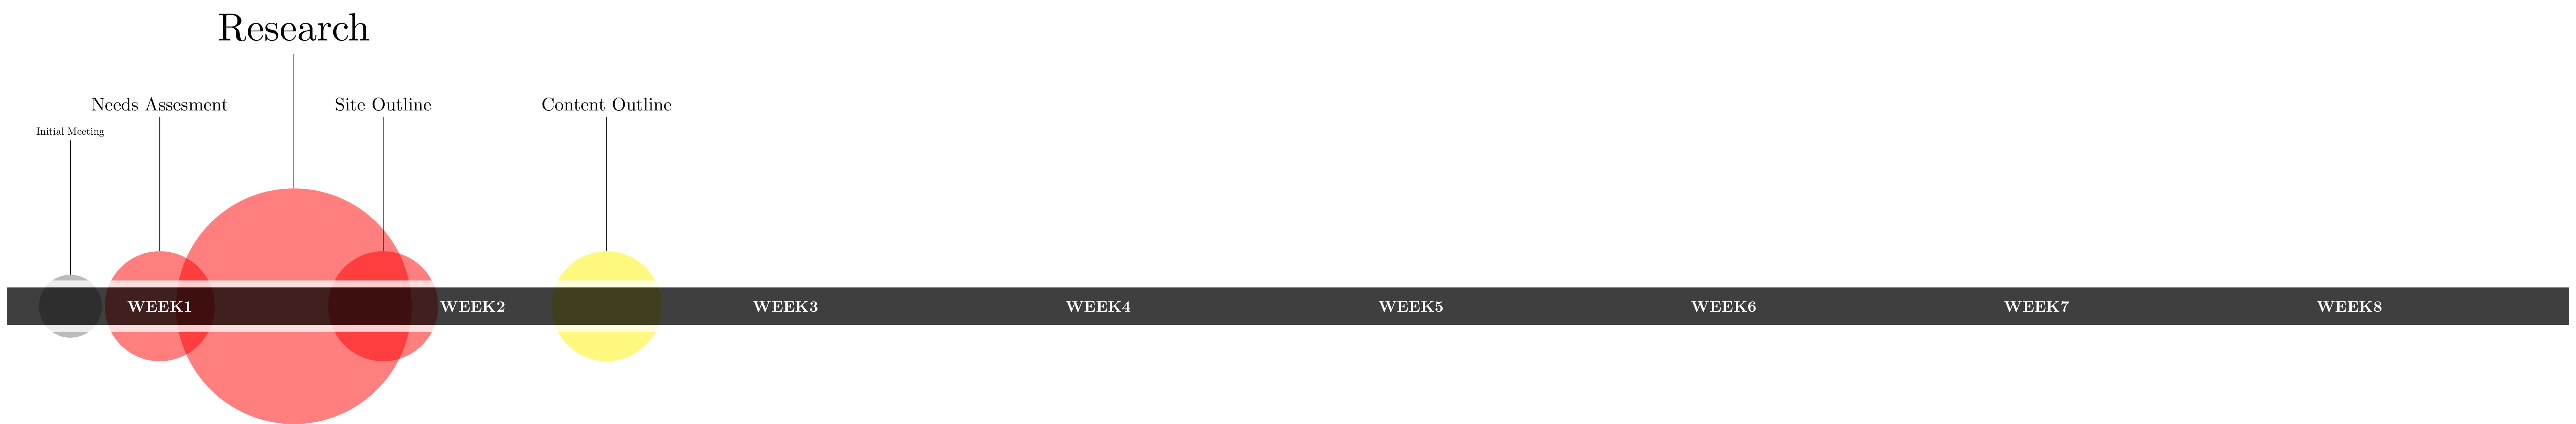
This code generates a Gantt chart using the TikZ package in LaTeX. The chart represents a project plan with several tasks, each belonging to one of three phases: initial, planning, or content. The tasks are defined in a file named "tasks.dat" using the DataTool package, and include a name, position, size, and phase. The chart also includes labeled weeks along the x-axis.
The code first loads the tasks data from the "tasks.dat" file using DataTool's \DTLloaddb command, and then defines several TikZ styles to represent the different phases and to format the week labels. The tasks are then drawn as circles with a fill color corresponding to their phase and positioned according to their position value from the data file. The task names are written above each task as labels. Finally, a filled rectangle is drawn along the y-axis to create a bar that extends across the entire chart, and labeled weeks are added along the x-axis using the week style.
Keywords
latex, diagram, tikz, datatool, filecontents, node, style, filldraw, rectangle, opacity, foreach, anchor, minimum size, draw, line width, font, text, scale.
Source Code
\documentclass{standalone}
\usepackage{datatool}
\usepackage{tikz}
\usetikzlibrary{shadows}
\usetikzlibrary{positioning}
%\usetikzlibrary{calc,intersections}

\usepackage{filecontents}
\begin{filecontents*}{tasks.dat}
phase,taskid,name,position,size
initial,initialmeeting,Initial Meeting,-2,4
planning,needsassesment,Needs Assesment,0,7
planning,research,Research,3,15
planning,siteoutline,Site Outline,5,7
content,contentoutline,Content Outline,10,7
\end{filecontents*}

\DTLloaddb[noheader=false]{tasks}{tasks.dat}

\begin{document}
\begin{tikzpicture}[week/.style={font=\bfseries, text=white},
initial/.style={fill=black!60,circle,opacity=0.5},
planning/.style={fill=red,circle,opacity=0.5},
content/.style={fill=yellow,circle,opacity=0.5} ]

%%%%% Tasks
\DTLforeach*{tasks}{\phase=phase, \taskid=taskid, \name=name, \position=position,\size=size}{\node(\taskid)[\phase, minimum size=\size em] at (\position, 0) {};
\draw (node cs:name=\taskid, anchor=north) to ++(0,3) node[above, scale=\size/6] {\name};
}


\filldraw[fill=black, draw=white,line width=1ex,opacity=0.75] (-3.5,-0.5) rectangle (54,0.5);

%%%%% Weeks.
\node[week] at (0,0) {WEEK1};
\node[week] at (7,0) {WEEK2};
\node[week] at (14,0) {WEEK3};
\node[week] at (21,0) {WEEK4};
\node[week] at (28,0) {WEEK5};
\node[week] at (35,0) {WEEK6};
\node[week] at (42,0) {WEEK7};
\node[week] at (49,0) {WEEK8};
\end{tikzpicture}
\end{document}