Description
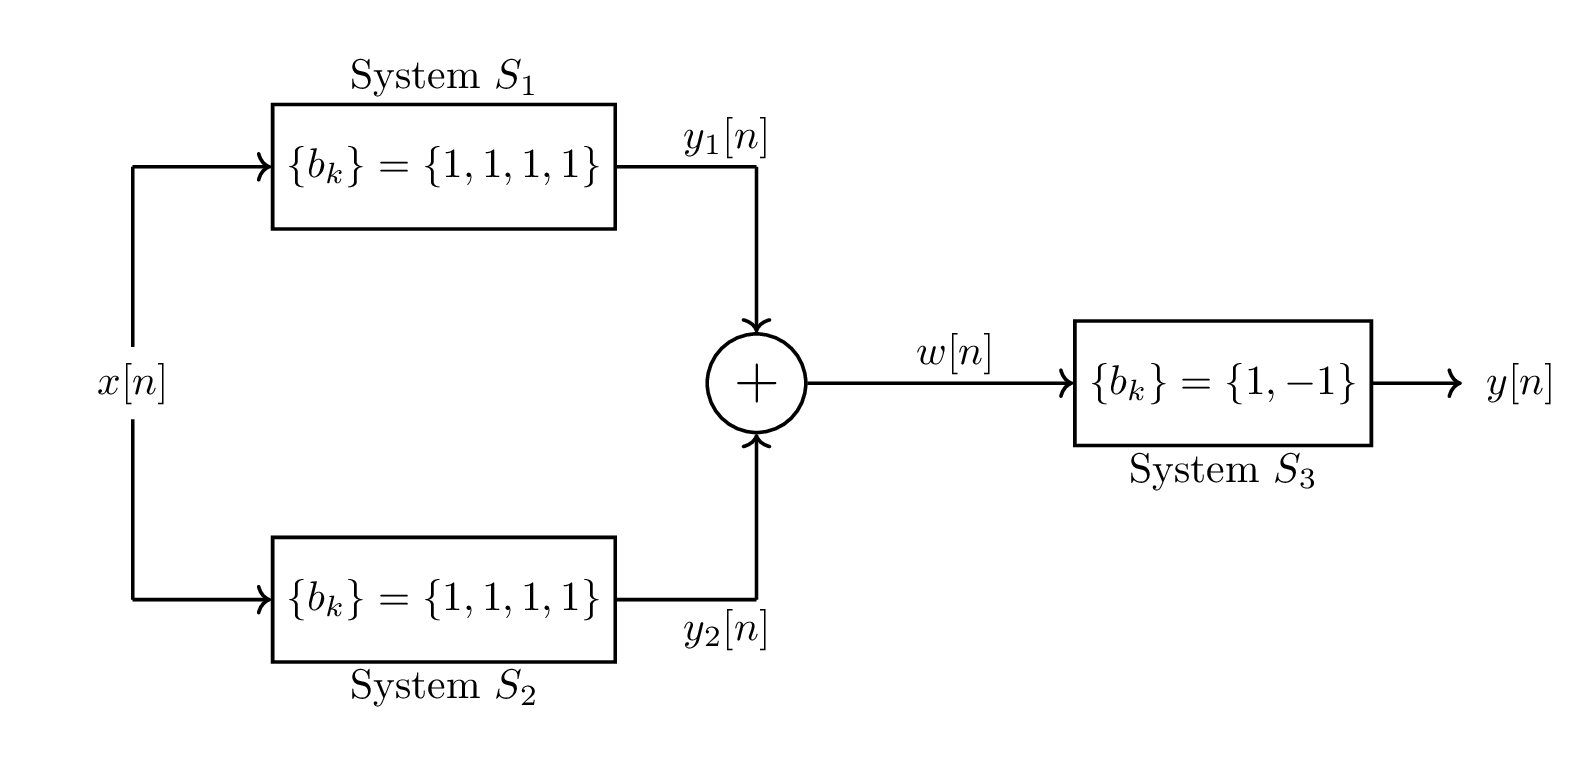
The code is a LaTeX document that uses the tikz package to create a block diagram. The block diagram represents a signal processing system consisting of three subsystems (S1, S2, S3) and a signal input x[n]. The first subsystem (S1) is represented by a block with the label "System S1" and has a transfer function of b_k = 1. The second subsystem (S2) is represented by a block with the label "System S2" and has a transfer function of b_k = 1. The output of S1 is added to the output of S2 by a summation block represented by a circle with a plus sign inside. The resulting signal is then passed through a third subsystem (S3) represented by a block with the label "System S3" and a transfer function of b_k = -1. The output of S3 is represented by the label "y[n]" and the intermediate signals are labeled "y1[n]" and "y2[n]". The diagram also includes several coordinate nodes used to connect the blocks and a few text labels used to annotate the diagram.
Keywords
tikz, automata, arrows.meta, circuits, node distance, thick, rectangle, minimum height, minimum width, circle, coordinate, text label.
Source Code
\documentclass{standalone}
\usepackage{pst-sigsys}	%Not used in the creation of this document
\usepackage{tikz}
\usetikzlibrary{arrows,automata}
\usetikzlibrary{automata,positioning,arrows.meta}
\usetikzlibrary{circuits}
\begin{document}

\tikzset{%
	block/.style    = {draw, thick, rectangle, minimum height = 3em,
		minimum width = 3em},
	mult/.style    = {draw, circle, node distance = 2cm}, % Multipler
	sum/.style      = {draw, circle, node distance = 2cm}, % Adder
	input/.style    = {coordinate}, % Input
	output/.style   = {coordinate} % Output
	label/.style   = {draw=none} % Text label

}
\newcommand{\suma}{\Large$+$}
\newcommand{\mult}{\Large$\times$}
\newcommand{\inte}{$\displaystyle \int$}
\newcommand{\derv}{\Huge$\frac{d}{dt}$}

\begin{tikzpicture}[auto, node distance=2cm,thick]
\matrix[column sep = .75cm, row sep = .75cm]
{   & & & & & & &\\
	\node [coordinate](a1){}; & \node [block](A2){$\{b_k\}=\{1,1,1,1\}$}; &
	\node [coordinate](a3){}; & & & & &\\
	\node (x){$x[n]$}; & & \node [sum](add1){\suma}; &  &\node [coordinate](b5){}; & \node [block](B6){$\{b_k\}=\{1,-1\}$}; & \node [coordinate](b7){};& \node [coordinate](b8){}; \\
	\node [coordinate](c1){}; & \node [block](C2){$\{b_k\}=\{1,1,1,1\}$}; & \node [coordinate](c3){}; & & & & &\\
	& & & & & & &\\
};
\draw [-] (x) to (a1);
\draw [->] (a1) to (A2);
\draw [-] (A2) to (a3);
\draw [->] (a3) to (add1);
\draw [-] (x) to (c1);
\draw [->] (c1) to (C2);
\draw [-] (C2) to (c3);
\draw [->] (c3) to (add1);
\draw [->] (add1) to (B6);
\draw [->] (B6) to (b7);

%draw S text labels
\node[label,shift={(0,0.75)}] at (A2) {System $S_1$};
\node[label,shift={(0,-0.75)}] at (C2) {System $S_2$};
\node[label,shift={(0,-0.75)}] at (B6) {System $S_3$};
\node[label,shift={(-0.25,0.25)}] at (a3) {$y_1[n]$};
\node[label,shift={(-0.25,-0.25)}] at (c3) {$y_2[n]$};
\node[label,shift={(-0.25,0.25)}] at (b5) {$w[n]$};
\node[label,shift={(-0.25,0)}] at (b8) {$y[n]$};
\end{tikzpicture}

\end{document}