Description
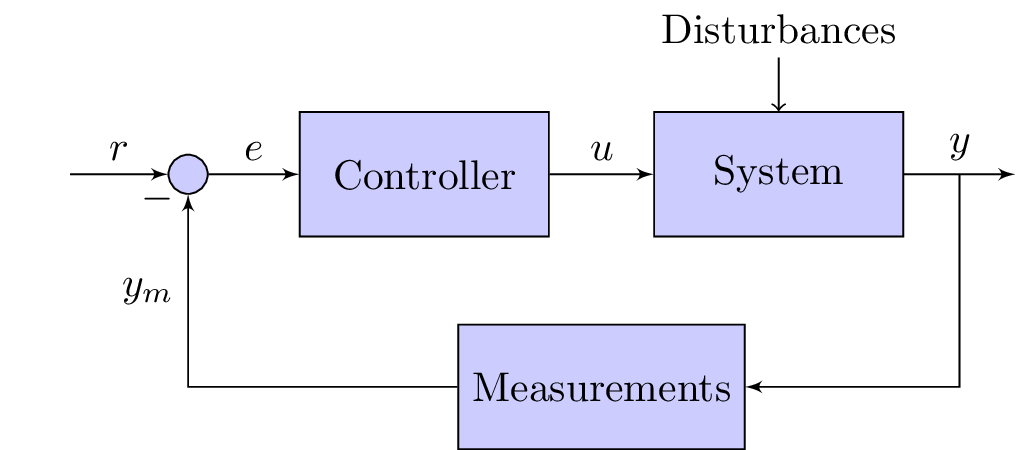
The code above is a LaTeX document that defines a block diagram using the TikZ package. The block diagram consists of a feedback control system with four main components: an input, a controller, a system, and an output. The controller and system blocks are connected by an arrow representing the control signal, and the system block is connected to the output block by an arrow representing the system's output. The input is connected to a summing junction, which is then connected to the controller block by an arrow representing the error signal. The output block is also connected to a measurements block, which is connected back to the summing junction by an arrow representing the negative feedback loop. The document defines various styles for the blocks and arrows, including the size, shape, and color of the blocks and the type of arrowhead used for the arrows.
Keywords
documentclass, standalone, tikz, shapes, arrows, block, sum, input, output, pinstyle, auto, node distance, >=latex, input, name, sum, right of, block, pin, node distance, system, output, below of, measurements, draw.
Source Code
\documentclass{standalone}

\usepackage{tikz}
\usetikzlibrary{shapes,arrows}
\begin{document}


\tikzstyle{block} = [draw, fill=blue!20, rectangle,
    minimum height=3em, minimum width=6em]
\tikzstyle{sum} = [draw, fill=blue!20, circle, node distance=1cm]
\tikzstyle{input} = [coordinate]
\tikzstyle{output} = [coordinate]
\tikzstyle{pinstyle} = [pin edge={to-,thin,black}]

% The block diagram code is probably more verbose than necessary
\begin{tikzpicture}[auto, node distance=2cm,>=latex']
    % We start by placing the blocks
    \node [input, name=input] {};
    \node [sum, right of=input] (sum) {};
    \node [block, right of=sum] (controller) {Controller};
    \node [block, right of=controller, pin={[pinstyle]above:Disturbances},
            node distance=3cm] (system) {System};
    % We draw an edge between the controller and system block to
    % calculate the coordinate u. We need it to place the measurement block.
    \draw [->] (controller) -- node[name=u] {$u$} (system);
    \node [output, right of=system] (output) {};
    \node [block, below of=u] (measurements) {Measurements};

    % Once the nodes are placed, connecting them is easy.
    \draw [draw,->] (input) -- node {$r$} (sum);
    \draw [->] (sum) -- node {$e$} (controller);
    \draw [->] (system) -- node [name=y] {$y$}(output);
    \draw [->] (y) |- (measurements);
    \draw [->] (measurements) -| node[pos=0.99] {$-$}
        node [near end] {$y_m$} (sum);
\end{tikzpicture}

\end{document}