Description
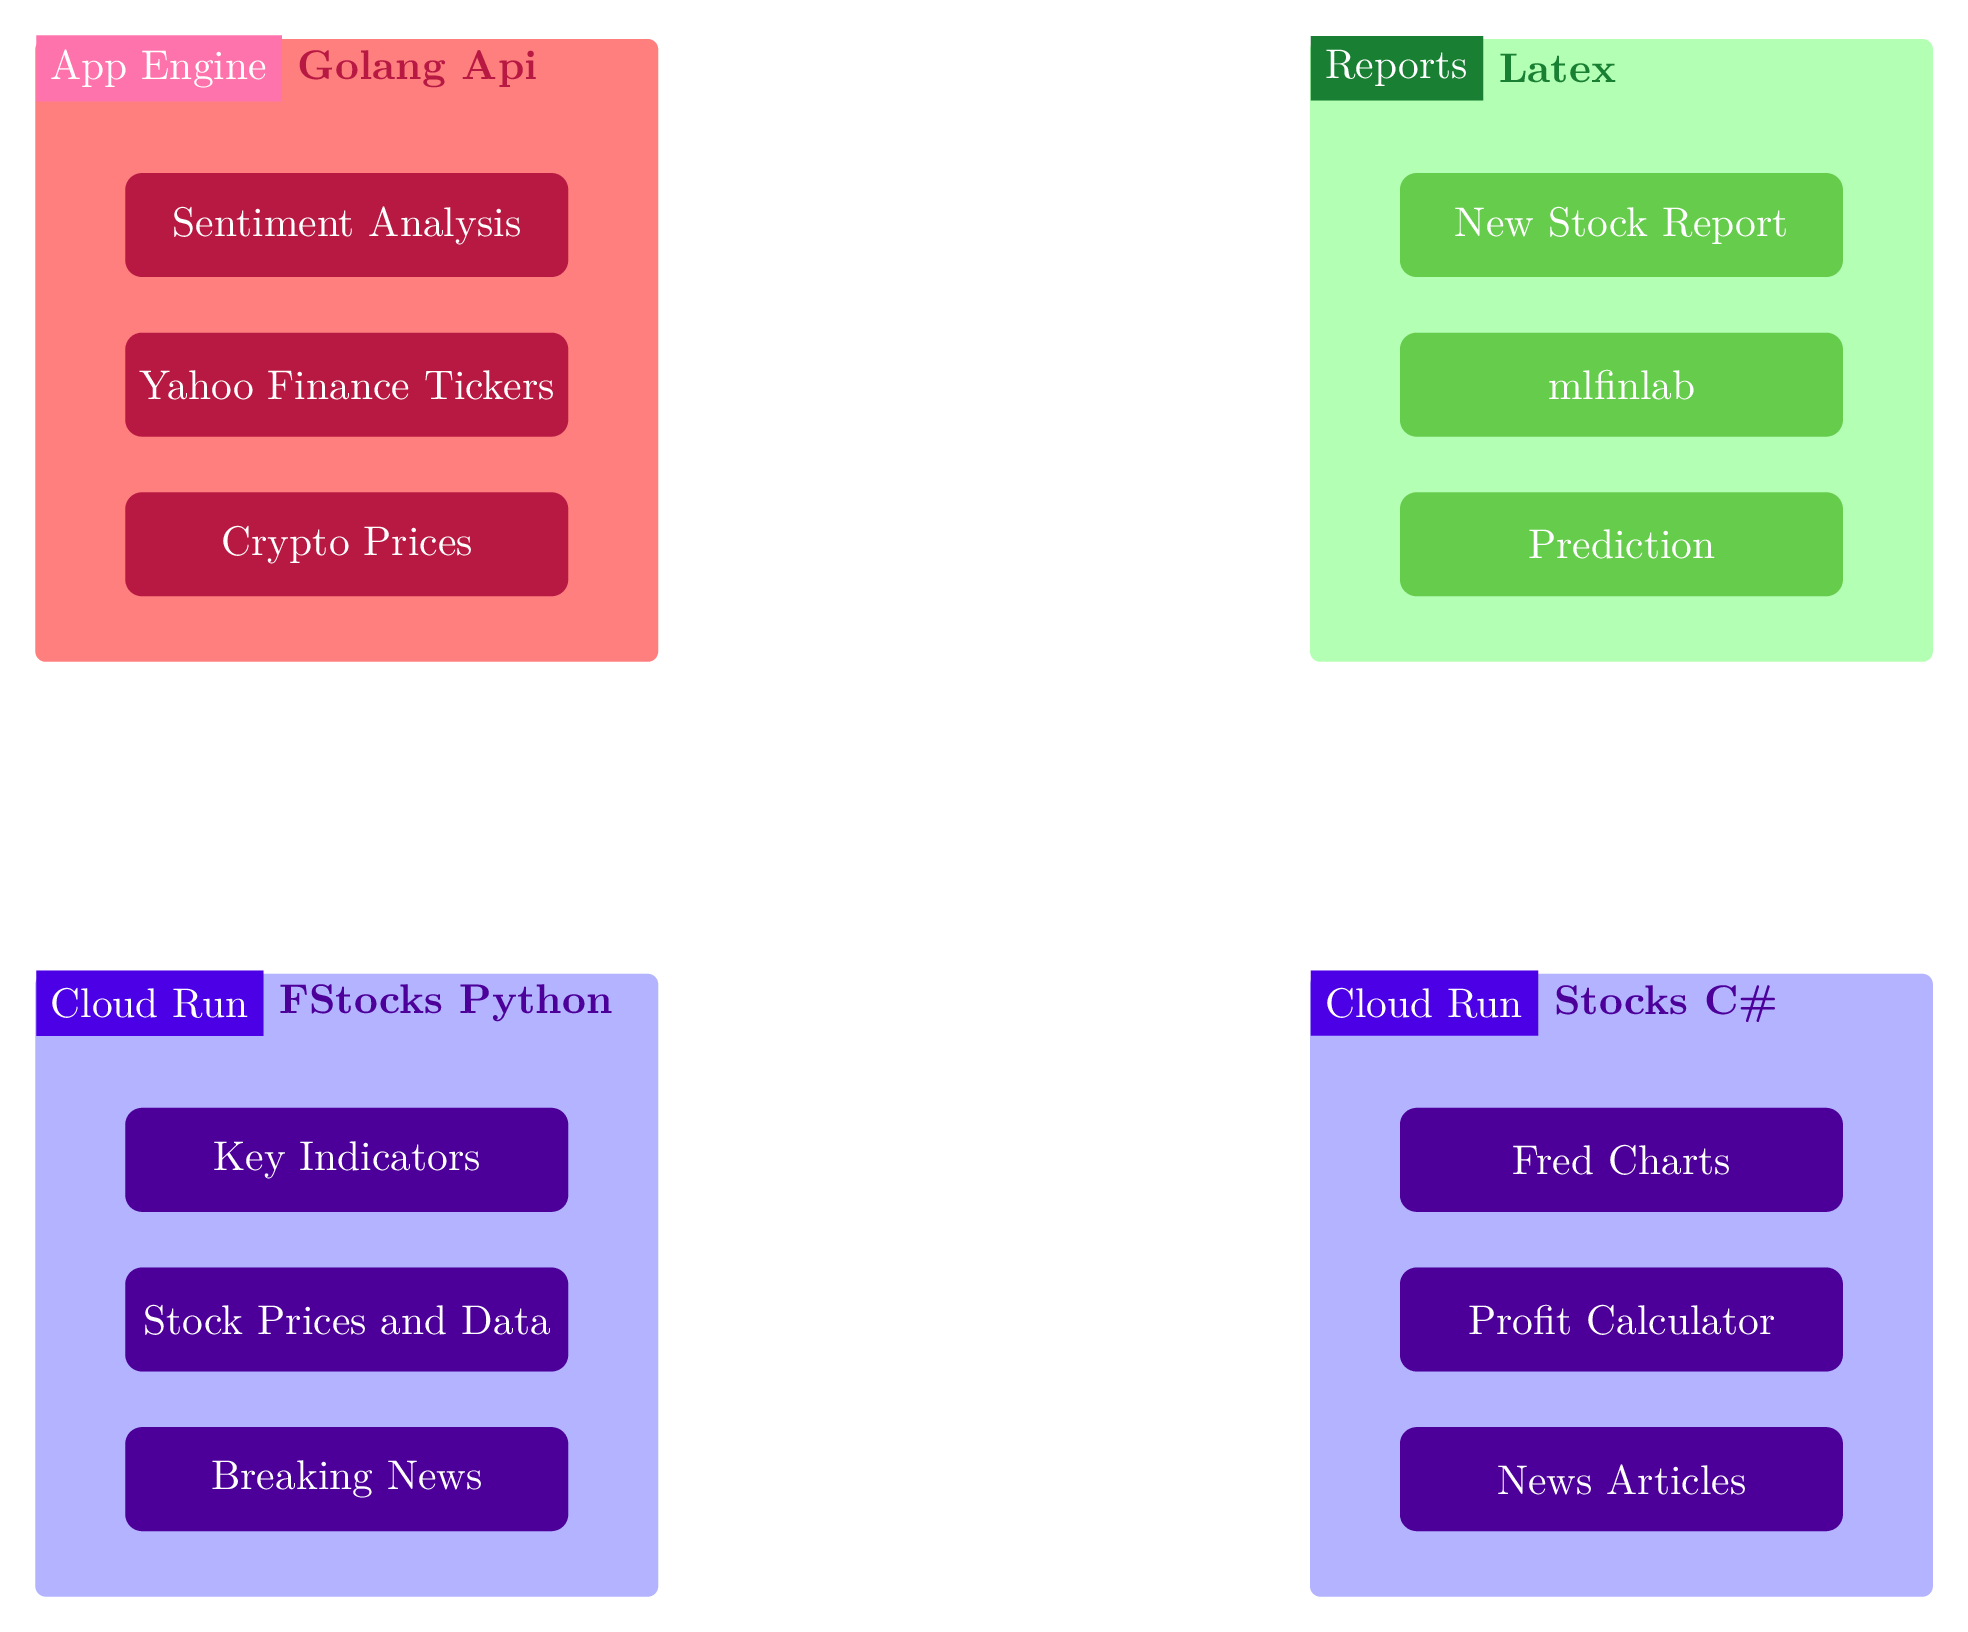
The code is a LaTeX document that defines a stock software architecture using TikZ package to create a graphical representation of the architecture. The architecture is composed of three cloud services: Cloud Run, Google Cloud C#, and App Engine, each represented by a rectangular box with rounded corners and a different color.
Inside each cloud service box, there are several colored boxes that represent different functionalities or features of that cloud service. The colors of the inner boxes vary depending on the cloud service they belong to. The boxes are arranged in a hierarchical manner, with the section headers on top and the specific features or functionalities at the bottom.
The code defines various styles for the elements in the architecture, such as sectionHeader, sectionContainer, and coloredBox. It also defines the colors used in the architecture, such as cloudrunMain, cloudrunSecond, appengineMain, appengineSecond, and reportsMain.
The code uses various TikZ commands to position the elements in the architecture relative to each other, such as above, below, left, and right. It also uses the calc library to perform mathematical operations on coordinates. Finally, the code uses the backgrounds library to add a background color to the architecture.
Keywords
tikz, node, foreach, draw, rectangle, above, right, of, fill, black, path, style.
Source Code
% Author: David Li
% Basic Stock Software Architecture
\documentclass[tikz, margin=3mm]{standalone}
\usetikzlibrary{shapes.multipart}
\usetikzlibrary{matrix, fit}
\usetikzlibrary{backgrounds}
\usetikzlibrary{positioning, calc}
% Define Colors
\definecolor{cloudrunMain}{rgb}{0.3, 0.0, 0.9}
\definecolor{cloudrunSecond}{rgb}{0.3, 0.0, 0.6}
\definecolor{lightblue}{rgb}{0.68, 0.85, 0.9}
\definecolor{dodgerblue}{rgb}{0.12, 0.56, 1.0}
\definecolor{appengineMain}{rgb}{1.85,0.45,0.68}
\definecolor{appengineSecond}{rgb}{0.72, 0.1, 0.26}
\definecolor{reportsMain}{rgb}{0.1, 0.5, 0.2}
\definecolor{reportsSecond}{rgb}{0.4, 0.8, 0.3}
\usetikzlibrary{fadings, shapes.arrows, shadows,calc}

\tikzset{
  sectionHeader/.style args = {#1}{
    draw=none,
    rectangle split, rectangle split horizontal, rectangle split parts=2,
    rectangle split draw splits=false, % figure this out
    %text width=3cm,
    align=center, thick,
    rectangle split part fill={#1,none}% end of the append after command
  },
  sectionContainer/.style = {
    draw,
    rectangle,
    inner sep=0.3cm,
    fill=gray,
    minimum height=3cm
  },
  coloredBox/.style n args={4}{
    text centered, fill=#4, minimum width = #1, minimum height= #2, text=white,
    text width = #3,
    rounded corners
  },
}
\begin{document}
\begin{tikzpicture}
% Invisible reference center node
\node[draw=none] (stock-arch) {};
% Cloud stocks
\node[rectangle, rounded corners=0.25em,draw=none, minimum width=15em, minimum height=15em, fill=blue!30] (fstocks) at ([xshift=-15em] stock-arch.west) {};
% Needed to adjust the yshift to get it perfectly positioned
\node[sectionHeader={cloudrunMain}, yshift=-0.725em, anchor=west] (title) at (fstocks.north west)        {\nodepart[color=white]{one} Cloud Run
        \nodepart{two} \textcolor{cloudrunSecond}{\textbf{FStocks Python}}};

\node[coloredBox={10em}{2.5em}{10em}{cloudrunSecond}, yshift=-4.5em, line width=0.01pt] (fstocks-key) at (fstocks.north) {Key Indicators};
\node[coloredBox={10em}{2.5em}{10em}{cloudrunSecond}, yshift=-1em, below of = fstocks-key, line width=0.01pt] (fstocks-data)  {Stock Prices and Data};
\node[coloredBox={10em}{2.5em}{10em}{cloudrunSecond}, yshift=-1em, below of = fstocks-data, line width=0.01pt] (fstocks-news)  {Breaking News};

% Google Cloud C# stocks
\node[rectangle,rounded corners=0.25em,draw=none, minimum width=15em, minimum height=15em, fill=blue!30] (stocks-app) at ([xshift=15em] stock-arch.east) {};
% Needed to adjust the yshift to get it perfectly positioned
\node[sectionHeader={cloudrunMain}, yshift=-0.725em, anchor=west] (title) at (stocks-app.north west)        {\nodepart[color=white]{one} Cloud Run
        \nodepart{two} \textcolor{cloudrunSecond}{\textbf{Stocks C\#}}};
\node[coloredBox={10em}{2.5em}{10em}{cloudrunSecond}, yshift=-4.5em, line width=0.01pt] (stocks-app-data) at (stocks-app.north) {Fred Charts};
\node[coloredBox={10em}{2.5em}{10em}{cloudrunSecond}, yshift=-1em, below of = stocks-app-data, line width=0.01pt] (stocks-app-profit)  {Profit Calculator};
\node[coloredBox={10em}{2.5em}{10em}{cloudrunSecond}, yshift=-1em, below of = stocks-app-profit, line width=0.01pt] (stocks-app-news)  {News Articles};

% GAE Golang library switch colours
\node[rectangle,rounded corners=0.25em,draw=none, minimum width=15em, minimum height=15em, fill=red!50] (gae-server) at ([yshift=15em] fstocks.north) {};
% Needed to adjust the yshift to get it perfectly positioned
\node[sectionHeader={appengineMain}, yshift=-0.725em, anchor=west] (title) at (gae-server.north west)        {\nodepart[color=white]{one} App Engine
        \nodepart{two} \textcolor{appengineSecond}{\textbf{Golang Api}}};
\node[coloredBox={10em}{2.5em}{10em}{appengineSecond}, yshift=-4.5em, line width=0.01pt] (gae-server-data) at (gae-server.north) {Sentiment Analysis};
\node[coloredBox={10em}{2.5em}{10em}{appengineSecond}, yshift=-1em, below of = gae-server-data, line width=0.01pt] (gae-server-profit)  {Yahoo Finance Tickers};
\node[coloredBox={10em}{2.5em}{10em}{appengineSecond}, yshift=-1em, below of = gae-server-profit, line width=0.01pt] (gae-server-news)  {Crypto Prices};

% GAE Golang library switch colours
\node[rectangle,rounded corners=0.25em,draw=none, minimum width=15em, minimum height=15em, fill=green!30] (reports) at ([yshift=15em] stocks-app.north) {};
% Needed to adjust the yshift to get it perfectly positioned
\node[sectionHeader={reportsMain}, yshift=-0.725em, anchor=west] (title) at (reports.north west)        {\nodepart[color=white]{one} Reports
        \nodepart{two} \textcolor{reportsMain}{\textbf{Latex}}};
\node[coloredBox={10em}{2.5em}{10em}{reportsSecond}, yshift=-4.5em, line width=0.01pt] (reports-new) at (reports.north) {New Stock Report};
\node[coloredBox={10em}{2.5em}{10em}{reportsSecond}, yshift=-1em, below of = reports-new, line width=0.01pt] (reports-mlfinlab)  {mlfinlab};
\node[coloredBox={10em}{2.5em}{10em}{reportsSecond}, yshift=-1em, below of = reports-mlfinlab, line width=0.01pt] (reports-prediction)  {Prediction};

\end{tikzpicture}
\end{document}