Description
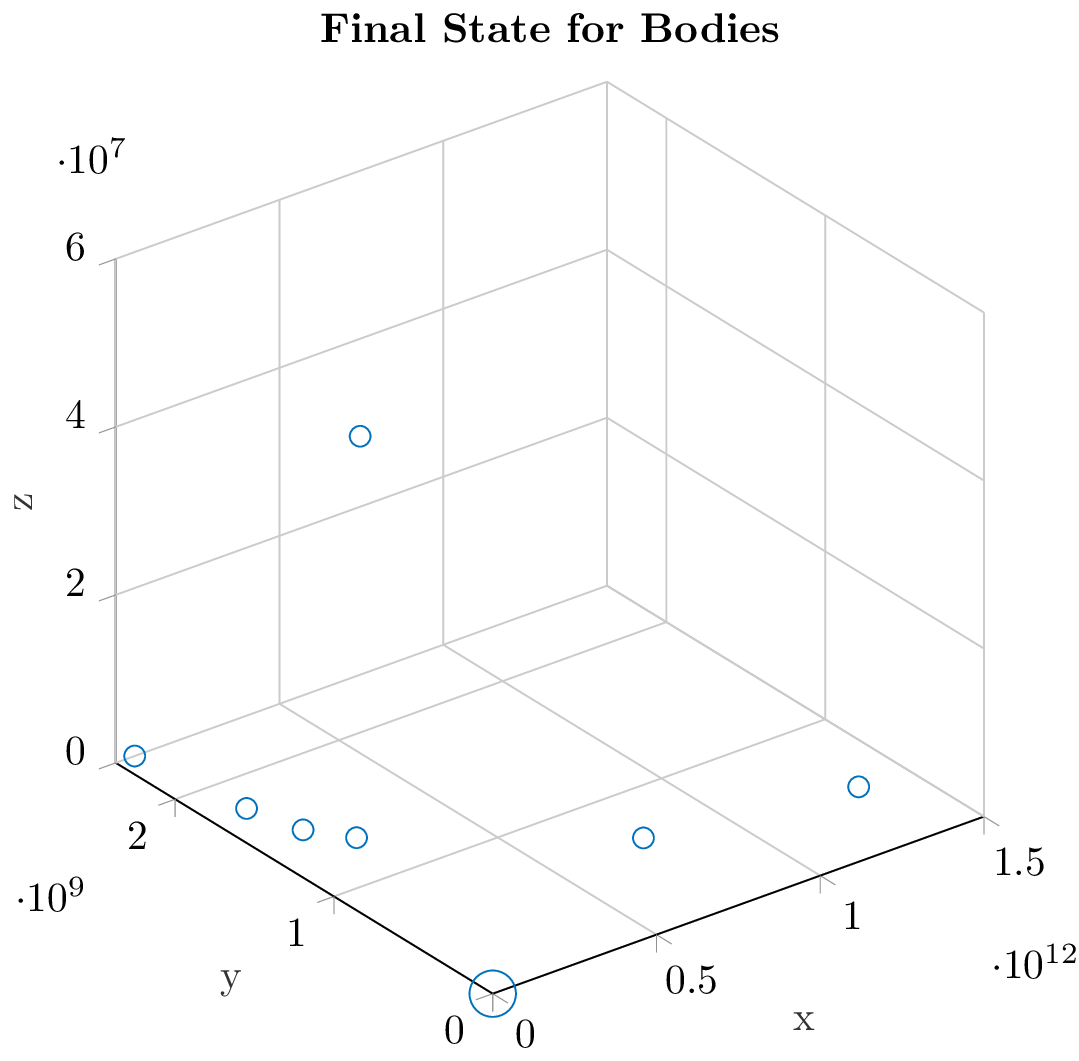
The code is a LaTeX document that produces a 3D scatter plot using the pgfplots package and TikZ graphics language. The plot visualizes the final state for bodies and has x, y, and z axes labeled with x, y, and z respectively. The data for the plot is provided in a table format within the code, with each row representing a single data point. The data includes x, y, and z coordinates for each point, as well as a size value that is used to adjust the size of the markers in the scatter plot. The scatter plot is colored with a predefined color, mycolor1, and the size of each marker is adjusted based on the size value provided in the data table. Overall, the code uses a combination of LaTeX, pgfplots, and TikZ to produce a 3D scatter plot with customized marker sizes and colors.
Keywords
pgfplots, tikzpicture, scatter, only marks, mark options, visualization, legend, table, row, sep, crcr, xlabel, ylabel, zlabel, view, axis, background, fill, white, xmajorgrids, ymajorgrids, zmajorgrids, mark size, color, mycolor1, width, height, scale, axis line, legend style.
Source Code
\documentclass{standalone}

  \usepackage{pgfplots}
  \pgfplotsset{compat=newest}
  %% the following commands are needed for some matlab2tikz features
  \usetikzlibrary{plotmarks}
  \usetikzlibrary{arrows.meta}
  \usepgfplotslibrary{patchplots}
  \usepackage{grffile}
  \usepackage{amsmath}

  %% you may also want the following commands
  %\pgfplotsset{plot coordinates/math parser=false}
  %\newlength\figureheight
  %\newlength\figurewidth
\definecolor{mycolor1}{rgb}{0.00000,0.44700,0.74100}
\begin{document}

% This file was created by matlab2tikz.
%
%The latest updates can be retrieved from
%  http://www.mathworks.com/matlabcentral/fileexchange/22022-matlab2tikz-matlab2tikz
%where you can also make suggestions and rate matlab2tikz.
%
% This file was created by matlab2tikz.
%
%The latest updates can be retrieved from
%  http://www.mathworks.com/matlabcentral/fileexchange/22022-matlab2tikz-matlab2tikz
%where you can also make suggestions and rate matlab2tikz.
%
\definecolor{mycolor1}{rgb}{0.00000,0.44700,0.74100}%
%
\begin{tikzpicture}

\begin{axis}[%
width=2.894in,
height=3.04in,
at={(0.487in,0.41in)},
scale only axis,
xmin=0,
xmax=1500000000000,
tick align=outside,
xlabel style={font=\color{white!15!black}},
xlabel={x},
ymin=0,
ymax=2374061464.1,
ylabel style={font=\color{white!15!black}},
ylabel={y},
zmin=0,
zmax=60000000,
zlabel style={font=\color{white!15!black}},
zlabel={z},
view={-37.5}{30},
axis background/.style={fill=white},
title style={font=\bfseries},
title={Final State for Bodies},
axis x line*=bottom,
axis y line*=left,
axis z line*=left,
xmajorgrids,
ymajorgrids,
zmajorgrids,
legend style={at={(1.03,1)}, anchor=north west, legend cell align=left, align=left, draw=white!15!black}
]
\addplot3[scatter, only marks, mark=o, color=mycolor1, mark options={}, scatter/use mapped color=mycolor1, visualization depends on={\thisrow{size} \as \perpointmarksize}, scatter/@pre marker code/.append style={/tikz/mark size=\perpointmarksize}] table[row sep=crcr]{%
x	y	z	size\\
355.01516663	0.45633240291	3.1373940057e-05	5.59016994374947\\
57860329160	2374061464.1	0.00013618376453	2.51246890528022\\
108185770600	1773462602.7	0.0014797416918	2.51246890528022\\
149592556230	1502928808.9	2189.5755515	2.51246890528022\\
149592556110	1143477886.9	51023397.742	2.5\\
227916793400	1327644037.8	0.00021862720095	2.51246890528022\\
778499725250	656310053.74	4.2228335855e-07	2.51246890528022\\
1352549908400	484968085.96	6.0340446e-08	2.51246890528022\\
};

\end{axis}
\end{tikzpicture}%
\end{document}