Description
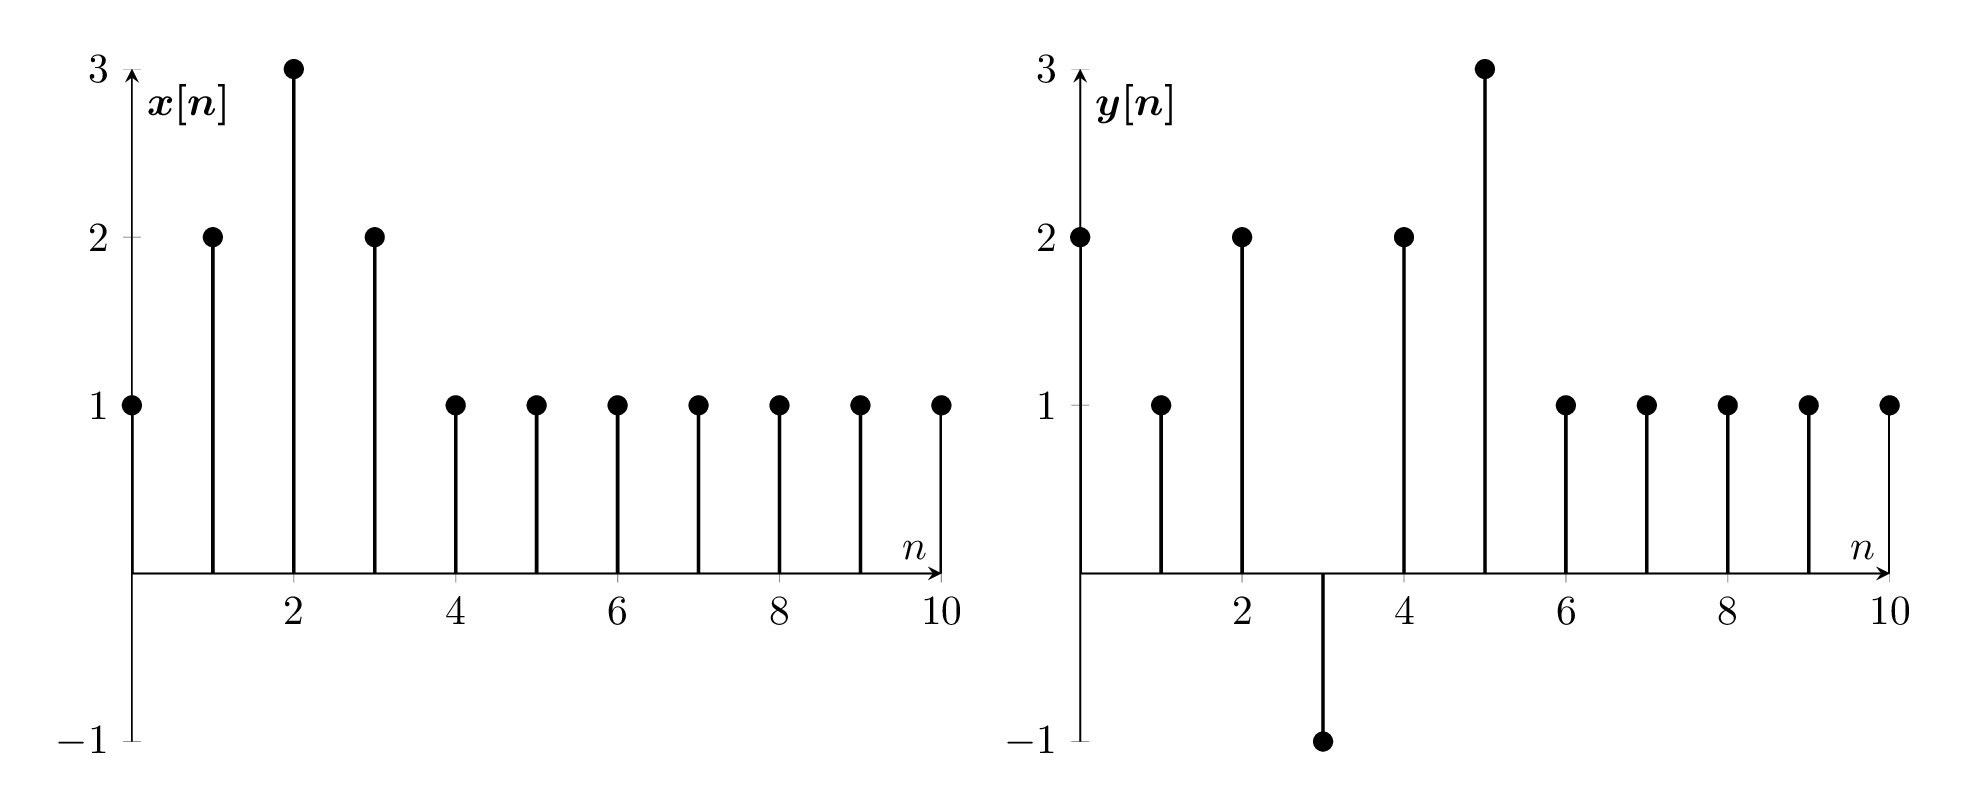
This is a LaTeX code that generates two plots side by side using the tikzpicture environment and the pgfplots package. The two plots represent discrete-time signals x[n] and y[n] using stem plots. The signals are stored in separate data files dataX.dat and dataY.dat, respectively.
The code begins by defining the document class and loading necessary packages, such as tikz, pgfplots, filecontents, and amsmath. Then, the two data files are defined using the filecontents environment.
Each plot is created using the axis environment from pgfplots, and the options are set using key-value pairs. The x[n] plot is first defined and then the y[n] plot is defined in the second tikzpicture environment.
Finally, the code ends with the end{document} command, indicating the end of the document.
Keywords
tikz, pgfplots, filecontents, amsmath, ycomb, y-axis, x-axis, ylabel, xlabel, xtick, ymin, ymax, n, xn, yn.
Source Code
\documentclass[border={10pt}]{standalone}
\usepackage{tikz,pgfplots,filecontents,amsmath}
\pgfplotsset{compat=1.5}

\begin{filecontents}{dataX.dat}
 n   xn
 0   1.0
 1   2.0
 2   3.0
 3   2.0
 4   1.0
 5   1.0
 6   1.0
 7   1.0
 8   1.0
 9   1.0
 10  1.0
\end{filecontents}

\begin{filecontents}{dataY.dat}
	n   yn
	0   2.0
	1   1.0
	2   2.0
	3   -1.0
	4   2.0
	5   3.0
	6   1.0
	7   1.0
	8   1.0
	9   1.0
	10  1.0
\end{filecontents}

\begin{document}

\begin{tikzpicture}
\begin{axis}
[%%%%%%%%%%%%%%%%%%%%%%%%%%%%%%%%%%%
    axis x line=middle,
    axis y line=middle,
    every axis x label={at={(current axis.right of origin)},anchor=north west},
    every axis y label={at={(current axis.above origin)},anchor= north west},
    every axis plot post/.style={mark options={fill=black}},
    xlabel={$n$},
    ylabel={$\boldsymbol{x[n]}$},
    xtick={0,2,...,10},
    ymin=-1,
    ymax=3,
]%%%%%%%%%%%%%%%%%%%%%%%%%%%%%%%%%%%
\addplot+[ycomb,black,thick] table [x={n}, y={xn}] {dataX.dat};
\end{axis}
\end{tikzpicture}
\begin{tikzpicture}
\begin{axis}
[%%%%%%%%%%%%%%%%%%%%%%%%%%%%%%%%%%%
axis x line=middle,
axis y line=middle,
every axis x label={at={(current axis.right of origin)},anchor=north west},
every axis y label={at={(current axis.above origin)},anchor= north west},
every axis plot post/.style={mark options={fill=black}},
xlabel={$n$},
ylabel={$\boldsymbol{y[n]}$},
xtick={0,2,...,10},
ymin=-1,
ymax=3,
]%%%%%%%%%%%%%%%%%%%%%%%%%%%%%%%%%%%
\addplot+[ycomb,black,thick] table [x={n}, y={yn}] {dataY.dat};
\end{axis}
\end{tikzpicture}


\end{document}