Description
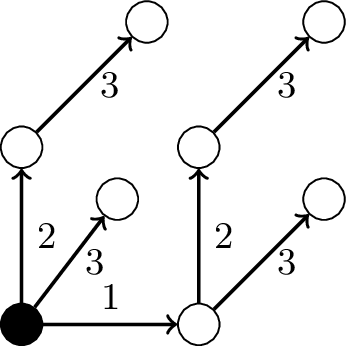
This is a LaTeX code for drawing a directed graph using the TikZ package. The graph consists of 7 nodes, each represented by a circle with a minimum size of 10pt. The nodes are connected by arrows, indicating the direction of the edges. The graph has two subgraphs, one on the left and the other on the right. The nodes on the left subgraph are connected to node 'r' using two arrows labeled 2 and 3. The nodes on the right subgraph are connected to node 'r' using one arrow labeled 1. The right subgraph has three nodes, with nodes r1a and r2tb connected to node 'r' using arrows labeled 1 and 2 respectively. Node r2tc is connected to node r1a using an arrow labeled 3. Node r3tb is connected to node r2tb using an arrow labeled 3. The left subgraph has four nodes with nodes r2a and r2t connected to node 'r' using arrows labeled 3 and 2 respectively. Node r3 is connected to node r2t using an arrow labeled 3. The code uses various TikZ options to specify the properties of the nodes and arrows such as fill color, line width, node distance, and arrow label position. The document class is set to standalone, which is used to create a PDF file containing only the TikZ picture.
Keywords
latex, tikz, positioning, node, circle, draw, fill, inner sep, minimum size, right of, above right of, above of, arrows.
Source Code
\documentclass[tikz]{standalone}
\tikzset{near start abs/.style={xshift=1cm}}

\usetikzlibrary{positioning}
\begin{document}
\begin{tikzpicture}[node distance=1.5cm]
    % place nodes
    \node[circle,draw=black, fill=black, inner sep=0pt,minimum size=10pt] (r) {};
    \node[circle,draw=black, fill=white, inner sep=0pt,right of=r, minimum size=10pt] (r1a)  {};
    \node[circle,draw=black, fill=white, inner sep=0pt,above right of=r, xshift=-0.25cm, minimum size=10pt] (r2a)  {};
    \node[circle,draw=black, fill=white, inner sep=0pt,above of=r, minimum size=10pt] (r2t)  {};
    \node[circle,draw=black, fill=white, inner sep=0pt,above right of=r2t, minimum size=10pt] (r3)  {};
    \node[circle,draw=black, fill=white, inner sep=0pt,above of=r1a, minimum size=10pt] (r2tb)  {};
    \node[circle,draw=black, fill=white, inner sep=0pt,above right of=r1a, minimum size=10pt] (r2tc)  {};
    \node[circle,draw=black, fill=white, inner sep=0pt,above right of=r2tb, minimum size=10pt] (r3tb)  {};
    % Arrows, right subgraph
    \draw[->,thick] (r) -- node[above] {\small{1}} ++(r1a);
    \draw[->,thick] (r1a) -- node[right] {\small{3}} ++(r2tc);
    \draw[->,thick] (r1a) -- node[right] {\small{2}} ++(r2tb);
    \draw[->,thick] (r2tb) -- node[right] {\small{3}} ++(r3tb);
    % Left subgraph
     \draw[->,thick] (r) -- node[right] {\small{3}} ++(r2a);
    \draw[->,thick] (r) -- node[right] {\small{2}} ++(r2t);
    \draw[->,thick] (r2t) -- node[right] {\small{3}} ++(r3);
\end{tikzpicture}
\end{document}