Description
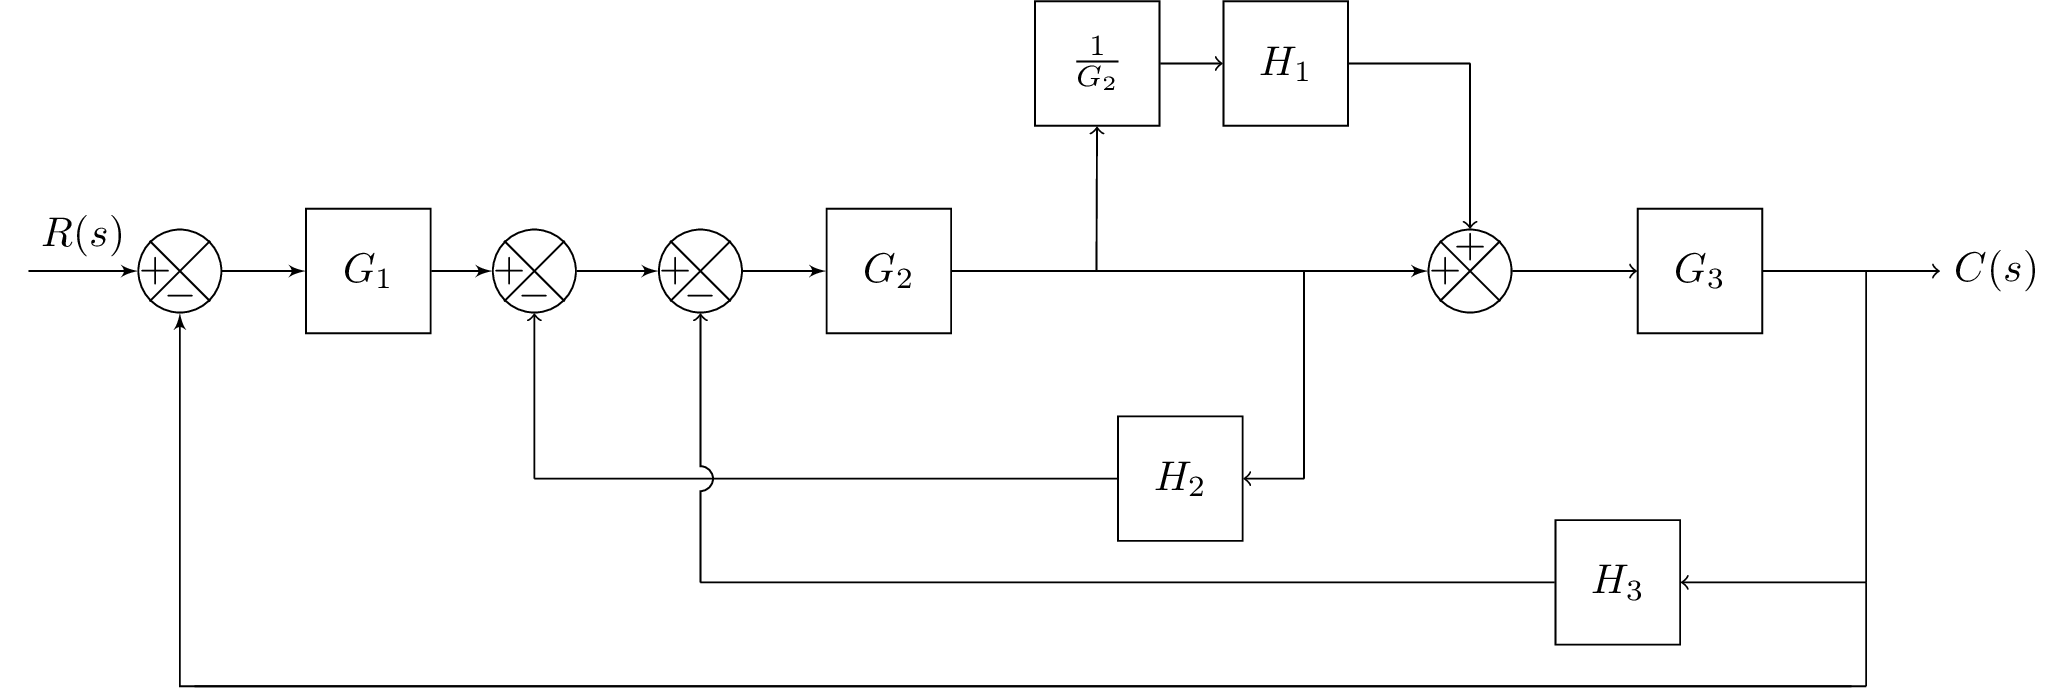
This defines a block diagram using the "blox" package in LaTeX. The block diagram represents a control system with multiple components such as adders, blocks, and branches. The system takes an input signal represented by node "A" and processes it through various components such as , , , , , and to produce an output signal represented by node "end".
The code uses various functions from the "blox" package to create the different components of the block diagram. The "\bXInput" function creates an input node, "\bXComp" creates a summing point, and "\bXBloc" creates a block with a transfer function. The "\bXLink" function is used to connect nodes and components with lines, and the "\bXBranchx" and "\bXBranchy" functions create branches in the diagram.
Also it defines a custom function called "connect" which creates an arc over a line at the intersection of two other lines. This function is used to connect components that are not directly in line with each other.
Keywords
tikzpicture, node, draw, rectangle, coordinate, path, fill, red, blue, black, thick, dashed, right, left, above, below.
Source Code
% standalone diagram for block diagrams
\documentclass{standalone}

\usepackage{blox}
\usepackage{tikz}
\usetikzlibrary{positioning}
\newcommand{\equal}{=}
\usepackage{tikz}
\usetikzlibrary{intersections}
\usepackage{tkz-euclide}
% Radius for arc over intersection
\def\radius{1.mm}

\tikzset{
	connect/.style args={(#1) to (#2) over (#3) by #4}{
		insert path={
			let \p1=($(#1)-(#3)$), \n1={veclen(\x1,\y1)},
			\n2={atan2(\y1,\x1)}, \n3={abs(#4)}, \n4={#4>0 ?180:-180}  in
			(#1) -- ($(#1)!\n1-\n3!(#3)$)
			arc (\n2:\n2+\n4:\n3) -- (#2)
		}
	},
}

\begin{document}
\begin{tikzpicture}
\bXInput{A}				% Input
\bXComp{B}{A}			% First adder
\bXLink[$R(s)$]{A}{B}	% Input Label
\bXBloc[2]{C}{$G_1$}{B}	% Block G1
\bXLink{B}{C}			% First added -- G1
\bXComp{D}{C}			% Second adder
\bXComp{E}{D}			% Third adder
\bXBloc[2]{G2}{$G_2$}{E}	% Block G2
\bXBranchx[5]{G2}{G2Right}	% Branch for H1, G2
\bXBranchy[-5]{G2Right}{invG2Left}	% node before 1 /G2
\bXBloc[-1.5]{invG2}{$\frac{1}{G_2}$}{invG2Left}	% Block 1/G2
\bXBloc[1.5]{H1}{$H_1$}{invG2}	% Block 1/G2
\bXBranchx[-3.5]{H1}{H1left}	% Branch for H1, G2

\bXBranchx[10]{G2}{Bran2}		% Branch after G2 and for H2
\bXBranchy[5]{Bran2}{Bran2Down}	% beneath branch 2
\bXBloc[-4.5]{H2Block}{$H_2$}{Bran2Down}
\bXSuma{adder4}{Bran2}
\bXLink{C}{D}
\bXLink{D}{E}
\bXLink{E}{G2}
\bXLink{G2}{adder4}		% G2 to adder

\bXBloc[3]{G3Block}{$G_3$}{adder4} % G3
\bXBranchx[4]{G3Block}{BranEnd} % branch before output
\bXBranchy[7.5]{BranEnd}{H3BlockRight} % Right H3 Block
\bXBranchy[2.5]{H3BlockRight}{BranEndReturn} % Right H3 Block
\bXBranchy[7.5]{E}{adder3down} % Below adder3
\bXBloc[-7.5]{H3Block}{$H_3$}{H3BlockRight}	% H3 Block
\draw[-] (BranEnd.center) -- (H3BlockRight.center);
\draw[->] (H3BlockRight.center) -- (H3Block);
\draw[-] (H3BlockRight.center) -- (BranEndReturn.center);
\bXBranchy[10]{B}{adder1Down}
\draw[-] (BranEndReturn.center) -- (adder1Down);

\bXBranchy[5]{D}{adder2down}	% beneath adder2
\bXBranchy[-5]{adder4}{adder4up}		% beneath adder4
%\bXLinkyx{EH1.center}{H2} % -- Connection for branch 1 and H1
\draw[->]  (G2Right.center) -- (invG2);
\draw[->] (invG2) -- (H1);
\draw[->] (Bran2Down.center) -- (H2Block);
\draw[-] (Bran2Down.center) -- (Bran2.center);
\draw[-,name path=H2 to adder2down] (H2Block) -- (adder2down.center); % used in intersection
\draw[->] (adder2down.center) -- (D);
\draw[-]  (H1) -- (adder4up.center);
\draw[->]  (adder4up.center)   -- (adder4);
\draw[->] (adder4) -- (G3Block);

\node[right = 0.5cm of BranEnd] (end) {$C(s)$};
\draw[->] (G3Block) -- (end);

\draw[-] (H3Block) -- (adder3down.center);
\path[name path=line] (adder3down.center) -- (E);
\path[name intersections={of=H2 to adder2down and line,by=inter}];
\draw[->,connect=(adder3down.center) to (E) over (inter) by 3pt ];

\bXLinkxy{BranEndReturn}{B}
\end{tikzpicture}
\end{document}