Description
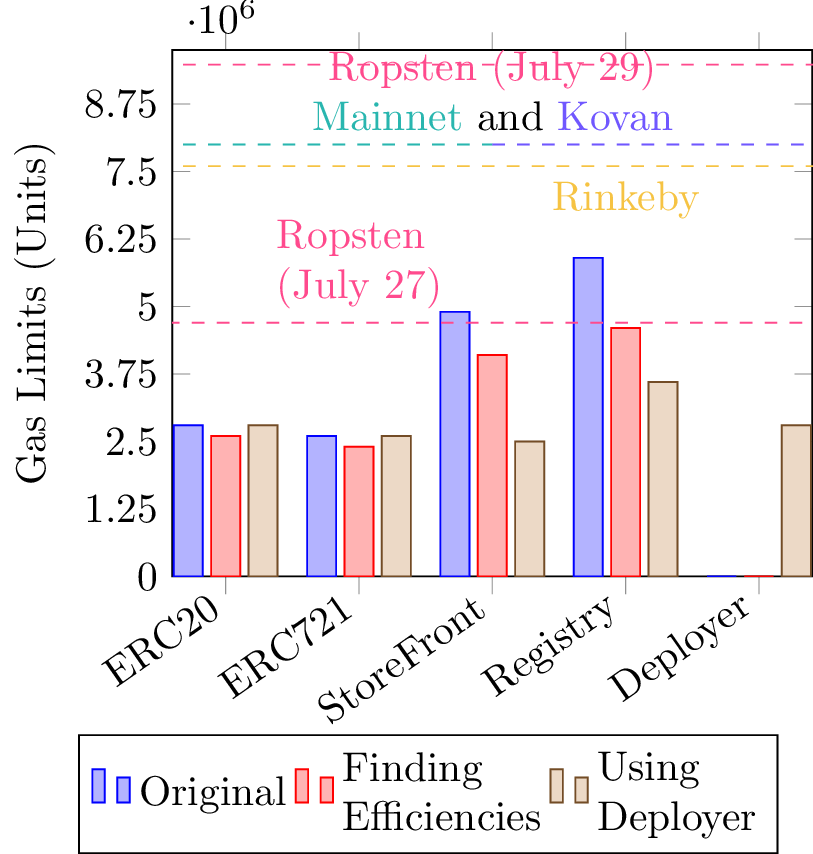
The code is a LaTeX document that produces a bar chart using the pgfplots package and the tikz graphics language. The chart shows the gas limits (in units) required for the deployment of several smart contracts: ERC20, ERC721, StoreFront, Registry, and Deployer. The x-axis shows the smart contract types, and the y-axis shows the gas limits. The gas limits are represented by bars, and there are three sets of bars representing the original deployment, a deployment with efficiency improvements, and a deployment using a Deployer. The chart also includes dashed lines representing the gas limits for the Mainnet, Kovan, Ropsten, and Rinkeby networks.
The code defines several colors used in the chart, such as mainnet, kovan, rinkeby, and ropsten. The gas limits are hardcoded into the code as coordinates for each of the bars. The legend is set at the bottom of the chart, with three entries corresponding to the three sets of bars.
The code also includes comments that provide additional information, such as the gas cost estimations for deploying each smart contract on the Ethereum network with a specific gas price, and the gas limits for each network represented by the dashed lines in the chart.
Keywords
tikz, node, draw, circle, edge, left, right, above, below, label.
Source Code
% Preamble: \

\documentclass{standalone}
\usepackage{pgfplots}
\usepackage{tikz}
\pgfplotsset{width=7cm,compat=1.16}
\usepackage{color}
\definecolor{mypink1}{rgb}{0.858, 0.188, 0.478}


\definecolor{blacktext}{HTML}{000000}

\definecolor{mainnet}{HTML}{29B6AF}
\definecolor{kovan}{HTML}{7057ff}

\definecolor{rinkeby}{HTML}{F6C343}

\definecolor{ropsten}{HTML}{FF4A8D}
\begin{document}
\begin{tikzpicture}
\begin{axis}[
x tick label style={
/pgf/number format/1000 sep=},
%xlabel=Smart Contracts,
ylabel=Gas Limits (Units),
%enlargelimits=0.15,
%legend style={cells={align=left}}
legend style={at={(0.4,-0.30)},
anchor=north,legend columns=3,cells={align=left}},
ybar,
bar width=7pt,
ytick={0,1.25e6,2.5e6,3.75e6,5e6, 6.25e6,7.5e6, 8.75e6,10e6},
ymin = 0,
ymax = 9.75e6,
xticklabels={ERC20,ERC721,StoreFront,Registry,Deployer},xtick={1930,1940,1950,1960,1970},
  x tick label style={rotate=35,anchor=east}]
]
\addplot coordinates {
(1930,28e5) (1940,26e5)
(1950,49e5) (1960,59e5) (1970,0)
};
\addplot coordinates {
(1930,26e5) (1940,24e5)
(1950,41e5) (1960,46e5) (1970,0)
};

\addplot coordinates {
(1930,28e5) (1940,26e5)
(1950,25e5) (1960,36e5) (1970,28e5)
};

\addplot [dashed, mainnet,line legend,
sharp plot,update limits=false,
] coordinates { (1910,80e5) (1950,80e5) }
node [above] at (1950,80e5) {\textcolor{mainnet}{Mainnet} \textcolor{blacktext}{and} \textcolor{kovan}{Kovan}};

\addplot [dashed,kovan,line legend,
sharp plot,update limits=false,
] coordinates { (1950,80e5) (1980,80e5) };

\addplot [dashed, ropsten,line legend,
sharp plot,update limits=false,
] coordinates { (1920,47e5) (1990,47e5) }
node [above,align=left] at (1940,47e5) {\textcolor{ropsten}{Ropsten} \\ \textcolor{ropsten}{(July 27)}};


\addplot [dashed, ropsten,line legend,
sharp plot,update limits=false,
] coordinates { (1910,94.8e5) (1990,94.8e5) }
node [below] at (1950,100.5e5) {\textcolor{ropsten}{Ropsten} \textcolor{ropsten} (July 29)};

\addplot [ dashed, rinkeby,line legend,
sharp plot,update limits=false,
] coordinates { (1910,76e5) (1990,76e5) }
node [below] at (1960,76e5) {\textcolor{rinkeby}{Rinkeby}};

\legend{Original, Finding \\ Efficiencies, Using \\ Deployer}
\end{axis}
\end{tikzpicture}

\end{document}

% Mainnet 8 mil 8000029
% Kovan   8 mil
% Rinkeby 7.6 mil
% Ropsten 4.7 mil July 27

% Renting out processing power to increase limits

% Ropsten 9.48 mil July 29
% Do unoptimizated
StoreFront Deployment costs
Gas Price is 20000000000 wei
gas estimation = 4924865 units
gas cost estimation = 98497300000000000 wei
gas cost estimation = 0.0984973 ether

HarvestSFRegistry Deployment cost.
Gas Price is 20000000000 wei
gas estimation = 5885566 units
gas cost estimation = 117711320000000000 wei
gas cost estimation = 0.11771132 ether

RewardToken Deployment cost.
Gas Price is 20000000000 wei
gas estimation = 2583571 units
gas cost estimation = 51671420000000000 wei
gas cost estimation = 0.05167142 ether

HarvestToken Deployment cost.
Gas Price is 20000000000 wei
gas estimation = 2780371 units
gas cost estimation = 55607420000000000 wei
gas cost estimation = 0.05560742 ether


% Opt by removing functionality
StoreFront Deployment costs
Gas Price is 20000000000 wei
gas estimation = 4154023 units
gas cost estimation = 98497300000000000 wei
gas cost estimation = 0.0984973 ether

HarvestSFRegistry Deployment cost.
Gas Price is 20000000000 wei
gas estimation = 4602312 units
gas cost estimation = 117711320000000000 wei
gas cost estimation = 0.11771132 ether

RewardToken Deployment cost.
Gas Price is 20000000000 wei
gas estimation = 2580571 units
gas cost estimation = 51671420000000000 wei
gas cost estimation = 0.05167142 ether

HarvestToken Deployment cost.
Gas Price is 20000000000 wei
gas estimation = 2750371 units
gas cost estimation = 55607420000000000 wei
gas cost estimation = 0.05560742 ether


% Optimizated by deployer

StoreFront Deployment costs
Gas Price is 20000000000 wei
gas estimation = 2154023 units
gas cost estimation = 98497300000000000 wei
gas cost estimation = 0.0984973 ether

HarvestSFRegistry Deployment cost.
Gas Price is 20000000000 wei
gas estimation = 2902312 units
gas cost estimation = 117711320000000000 wei
gas cost estimation = 0.11771132 ether

RewardToken Deployment cost.
Gas Price is 20000000000 wei
gas estimation = 2583571 units
gas cost estimation = 51671420000000000 wei
gas cost estimation = 0.05167142 ether

HarvestToken Deployment cost.
Gas Price is 20000000000 wei
gas estimation = 2750371 units
gas cost estimation = 55607420000000000 wei
gas cost estimation = 0.05560742 ether

Deployer 721 Cost

2825921 gas uints

% Using deployer