Description
This LaTeX code defines a document class for creating a standalone graphic using TikZ and pgfplots. The graphic is a simple line plot of discrete data points defined in the "data.dat" file. The code imports necessary packages, sets compatibility, and defines the plot parameters. The "data.dat" file contains four columns of data representing x-axis values and y-axis values. The document contains a single TikZ picture environment, with an axis environment defining the plot. The plot has x-axis and y-axis labels, ticks, and limits defined using the parameters set earlier. The data points are plotted using a ycomb plot style in black with a thick line. The resulting output will be a standalone graphic file.
Keywords
tikz, pgfplots, filecontents, amsmath, ycomb, black, thick, table, axis x line, axis y line, every axis x label, every axis y label, mark options, fill=black, xlabel, ylabel, xtick, xmax, ymin, ymax.
Source Code
\documentclass[border={10pt}]{standalone}
\usepackage{tikz,pgfplots,filecontents,amsmath}
\pgfplotsset{compat=1.5}
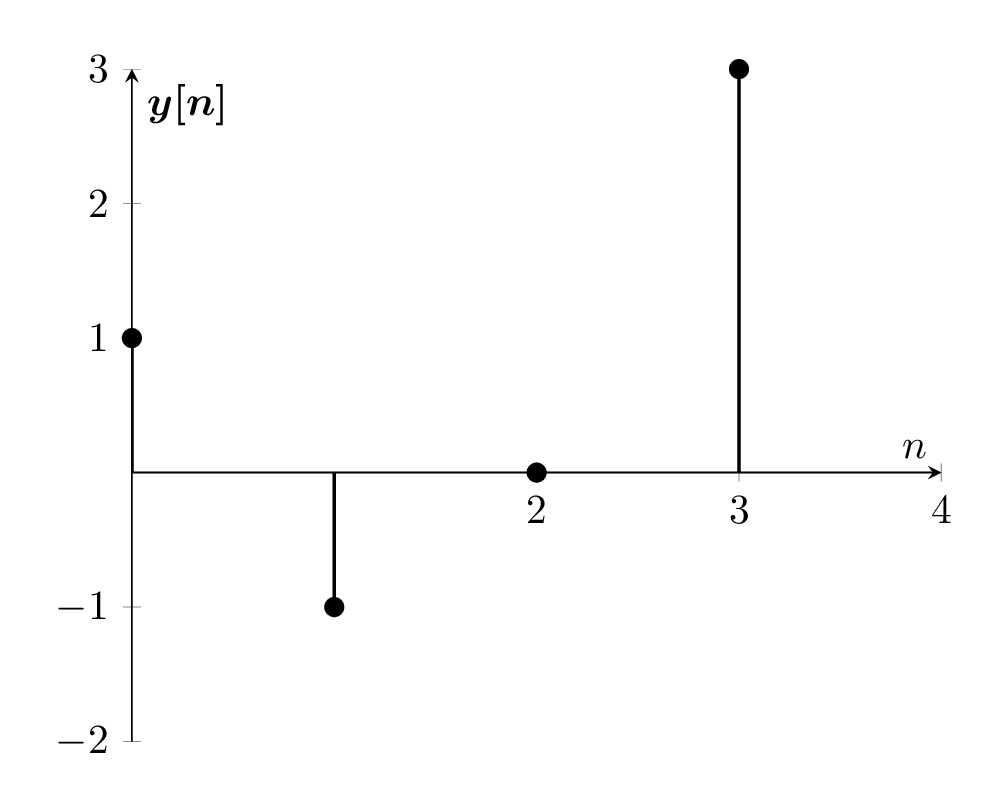
\begin{filecontents}{data.dat}
n yn
0 1
1 -1
2 0
3 3
\end{filecontents}
\begin{document}
\begin{tikzpicture}
\begin{axis}
[%%%%%%%%%%%%%%%%%%%%%%%%%%%%%%%%%%%
axis x line=middle,
axis y line=middle,
every axis x label={at={(current axis.right of origin)},anchor=north west},
every axis y label={at={(current axis.above origin)},anchor= north west},
every axis plot post/.style={mark options={fill=black}},
xlabel={$n$},
ylabel={$\boldsymbol{y[n]}$},
xtick={-1,0,2,3, 4},
xmax=4,
ymin=-2,
ymax=3,
]%%%%%%%%%%%%%%%%%%%%%%%%%%%%%%%%%%%
\addplot+[ycomb,black,thick] table [x={n}, y={yn}] {data.dat};
\end{axis}
\end{tikzpicture}
\end{document}