Description
This is a LaTeX code for generating a Smith chart with two circles in different colors. The code begins with the document class declaration and package imports, including tikz and pgfplots. The standalone document class is specified with the preview option. The smithchart library of pgfplots is also imported.
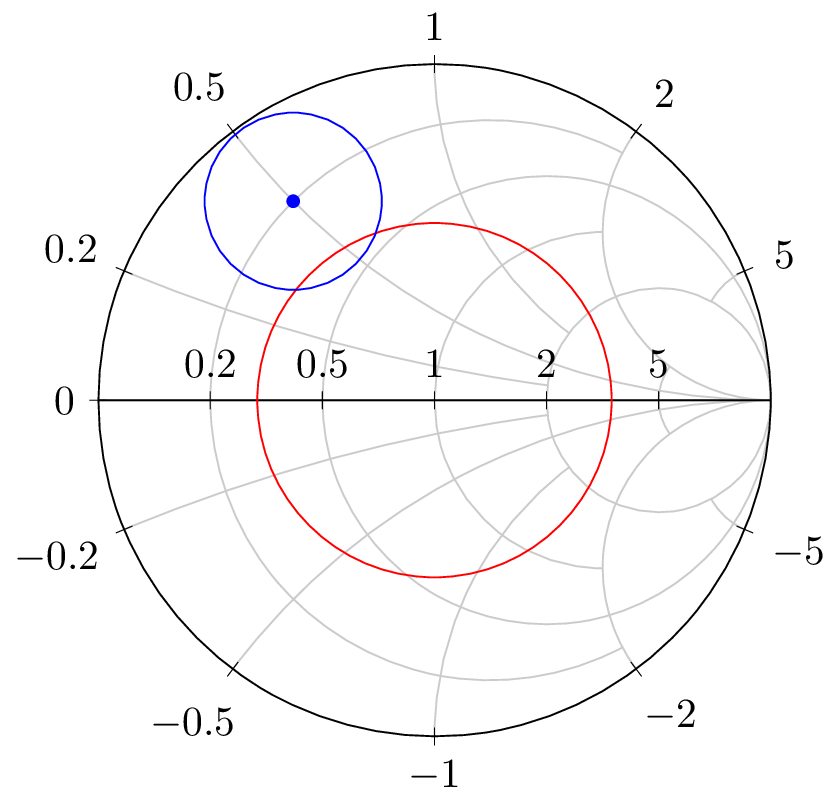
Within the tikzpicture environment, the smithchart is created. The smithchart environment provides the framework for creating Smith charts, which are a type of graphical representation used in electrical engineering to visualize the complex impedance plane.
Two circles are drawn using the path command, one in red with a radius of 1.5cm, and another in blue with a radius of 0.75cm, and its center at (0.2,0.5). A small blue circle with a radius of 0.05cm is also added to the center of the blue circle using the fill option to fill the circle with blue color.
Finally, the end{document} command closes the LaTeX document.
Keywords
tikz, pgfplots, smithchart.
Source Code
\documentclass[preview]{standalone}
\usepackage{tikz}
\usepackage{pgfplots}
\usepgfplotslibrary{smithchart}
\pgfplotsset{compat=1.11}

\begin{document}
    \begin{tikzpicture}
        \begin{smithchart}
        \path[draw=red] (0pt,0pt) circle (1.5cm);
        \path[draw=blue] (0.2,0.5) circle (0.75cm);
        \path[draw=blue,fill=blue] (0.2,0.5) circle (0.05cm);
        \end{smithchart}
    \end{tikzpicture}
\end{document}