Description
This code is a LaTeX document that defines a table containing a list of functions and their CPU utilization. The document uses several LaTeX packages, including "fontenc", "lmodern", "url", "xcolor", "tikz", "booktabs", "array", and "siunitx".
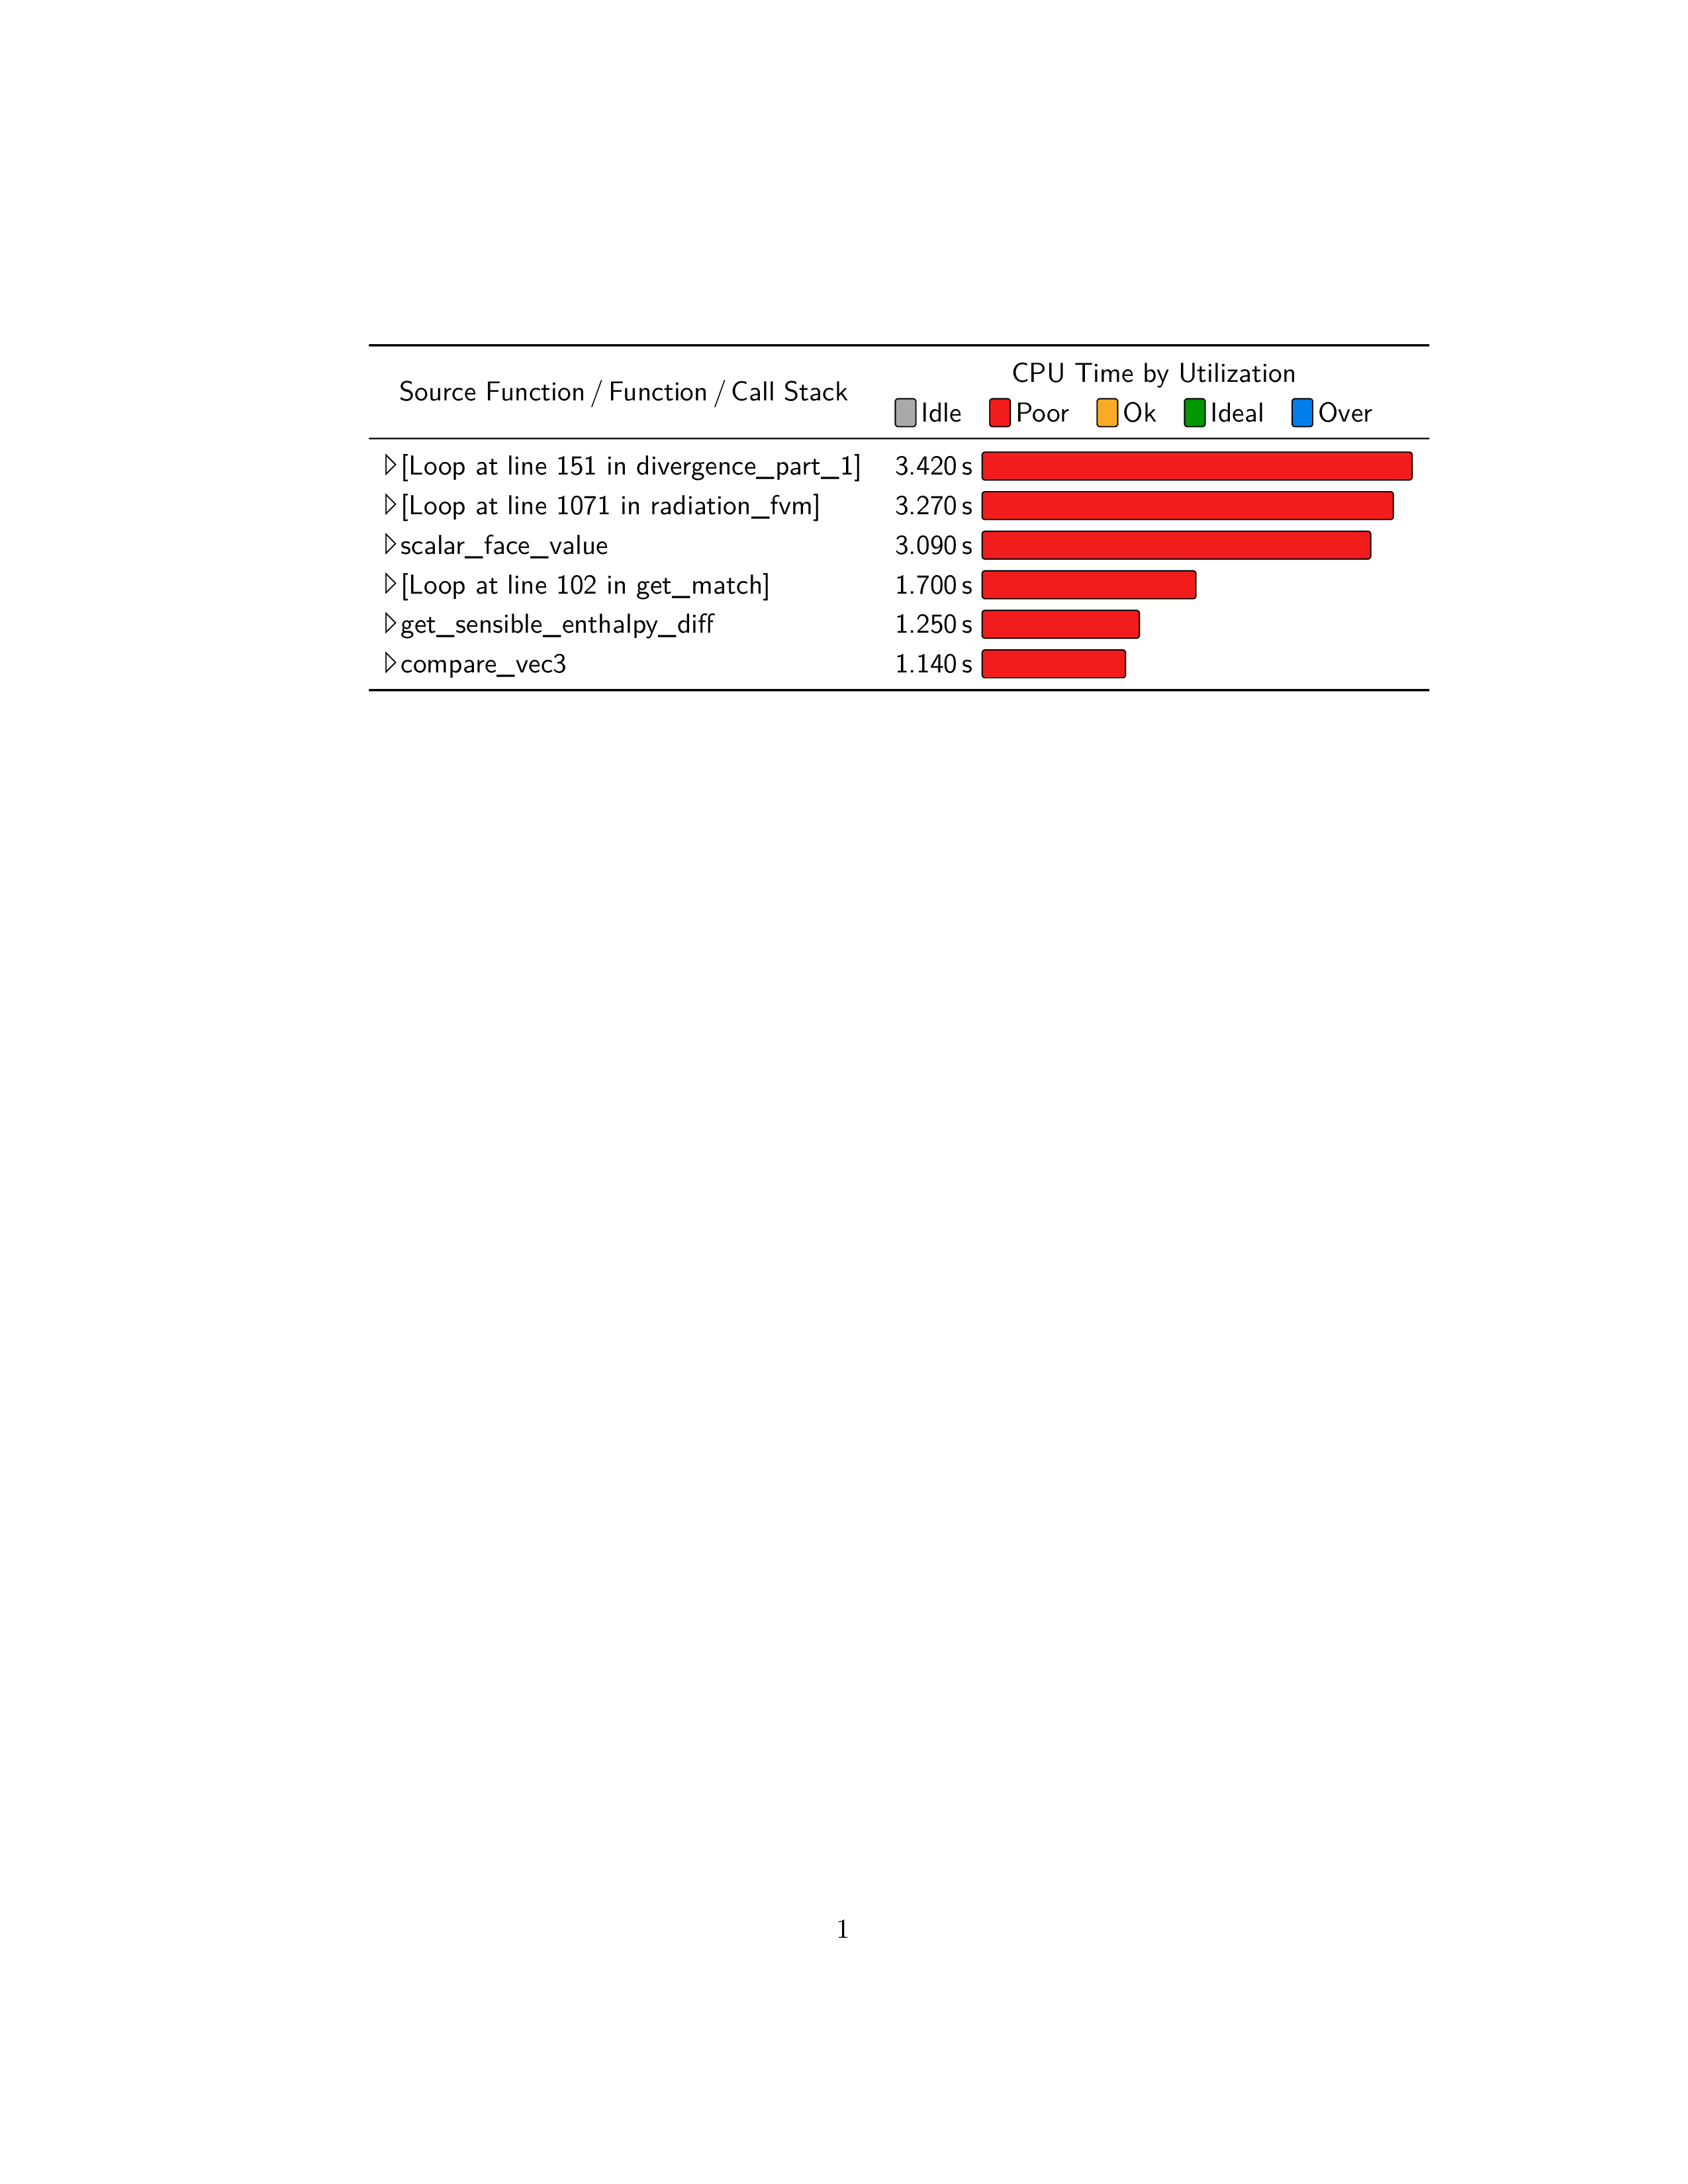
The table has three columns: the first column contains a small triangle symbol, the second column contains a numerical value indicating the CPU utilization, and the third column contains the name of the function. The numerical values in the second column are represented graphically as colored boxes of varying sizes, indicating the level of CPU utilization.
The code defines several custom commands and macros to generate the table, including a macro to create the colored boxes, a command to generate a legend for the colored boxes, and a command to generate the small triangle symbol. The table includes horizontal rules at the top, middle, and bottom, as well as vertical rules between the columns. The font used in the document is sans-serif.
Keywords
latex, tikz, graph, bar chart, colors, legend, table, tabular, multirow, siunitx, chart, function.
Source Code
\documentclass{article}

\usepackage[T1]{fontenc}
\usepackage{lmodern}

\usepackage{url}
\DeclareUrlCommand\function{\urlstyle{sf}}

\usepackage{xcolor}
\usepackage{tikz}
\usepackage{booktabs}
\usepackage{array}
\usepackage{multirow}
\usepackage{siunitx}

\definecolor{chart Idle}{gray}{.6}
\definecolor{chart Poor}{RGB}{242,28,28}
\definecolor{chart Ok}{RGB}{248,172,37}
\definecolor{chart Ideal}{RGB}{1,151,0}
\definecolor{chart Over}{RGB}{0,125,234}

\newdimen\tempdim
\newcommand*{\Triangle}{%
  \settoheight{\tempdim}{L}%
  \tikz[x=\tempdim, y=\tempdim]\draw(0,0) -- (.5,.5) -- (0,1) --cycle;%
}
\newcommand*{\ChartLegend}[1]{%
  \ifdim\lastkern=1sp %
    \hspace{1em}%
  \fi
  \ChartBox{0.75em}{#1}%
  \,#1%
  \kern-1sp\kern1sp\ignorespaces
}
\newcommand*{\ChartBox}[2]{%
  \begingroup
    \settoheight{\tempdim}{L}%
    \edef\tempheight{\the\tempdim}%
    \settodepth{\tempdim}{g}%
    \edef\tempdepth{\the\tempdim}%
    \tikz[
      baseline=0pt,
      inner sep=0pt,
    ]
    \node[
      fill={chart #2},
      draw,
      rounded corners=1pt,
      anchor=base,
    ]{%
      \vphantom{g\"A}%
      \pgfmathsetlength{\tempdim}{#1}%
      \kern\tempdim\relax
    };%
  \endgroup
}

\begin{document}
\sffamily
\renewcommand*{\arraystretch}{1.2}
\newcommand*{\chart}[2]{%
  #1 & \ChartBox{55mm/3.420*#1}{#2}%
}
\noindent
\begin{tabular}{>{\Triangle\,}lS[mode=text,detect-family,table-format=1.3]@{\,s~}l}
\toprule
\multicolumn{1}{c}{%
  \multirow{2}{*}{Source Function\,/\,Function\,/\,Call Stack}%
}&
  \multicolumn{2}{c}{CPU Time by Utilization}\\
\multicolumn{1}{c}{}& \multicolumn{2}{l}{%
  \ChartLegend{Idle}
  \ChartLegend{Poor}
  \ChartLegend{Ok}
  \ChartLegend{Ideal}
  \ChartLegend{Over}
}\\
\midrule
\relax[Loop at line 151 in \function{divergence_part_1}] &
  \chart{3.420}{Poor} \\
\relax[Loop at line 1071 in \function{radiation_fvm}] &
  \chart{3.270}{Poor} \\
\function{scalar_face_value} &
  \chart{3.090}{Poor} \\
\relax[Loop at line 102 in \function{get_match}] &
  \chart{1.700}{Poor} \\
\function{get_sensible_enthalpy_diff} &
  \chart{1.250}{Poor} \\
\function{compare_vec3} &
  \chart{1.140}{Poor} \\
\bottomrule
\end{tabular}
\end{document}