Description
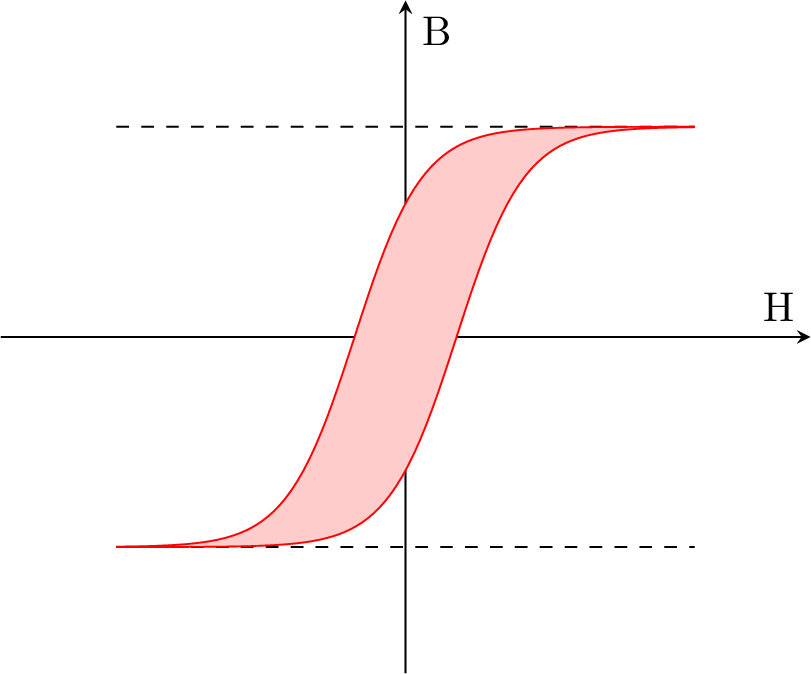
This LaTeX code defines a standalone document with a single tikzpicture environment that creates a 2D plot of a sigmoid function. The plot is created using the pgfplots package, and the fillbetween library is used to fill the area between two plots with a red!20 color.
The axis environment is used to set the properties of the plot, including the axis limits, labels, ticks, and line styles. The addplot command is used to add several plots to the axis.
Two of the added plots are dashed lines that span the entire x axis and have a constant y value of 2.5 and -2.5 respectively. The other two added plots are the sigmoid function, which is defined using mathematical expressions for x and y, and named paths A and B. The fill between command fills the area between the paths A and B with the specified color.
Keywords
pgfplots, fillbetween, tikzpicture, axis, plot, addplot, dashed, red, red!20, name path, samples, xlabel, ylabel, xmin, xmax, ymin, ymax, axis x line, axis y line, ticks.
Source Code
\documentclass{standalone}
\usepackage{pgfplots}
\usepgfplotslibrary{fillbetween}

\begin{document}
    \begin{tikzpicture}
        \begin{axis}[very thick,
                     samples = 100,
                     xlabel = H,
                     ylabel = B,
                     xmin = -7,
                     xmax = 7,
                     ymin = -4,
                     ymax = 4,
                     axis x line = middle,
                     axis y line = middle,
                     ticks = none]
            \addplot[dashed] plot (\x, 2.5);
            \addplot[dashed] plot (\x,-2.5);
            \addplot[red, name path=A] plot (\x, {5/(1 + exp(-1.7*\x+1.5))-2.5});
            \addplot[red, name path=B] plot (\x, {5/(1 + exp(-1.7*\x-1.5))-2.5});
            \addplot[red!20] fill between[of=A and B];
        \end{axis}
    \end{tikzpicture}
\end{document}