Description
This code generates a simple 2D graph of a straight line and some rectangles using the TikZ package within the pgfplots environment.
First, the document class is set to standalone and the necessary packages are loaded. The pgfplots package is set to the latest version using the 'compat' option.
The TikZ environment is initiated with the 'tikzpicture' command. Within the environment, a 2D graph is created using the 'axis' environment provided by pgfplots. The 'axis lines' option is set to 'middle' to display the axes crossing at the center of the graph.
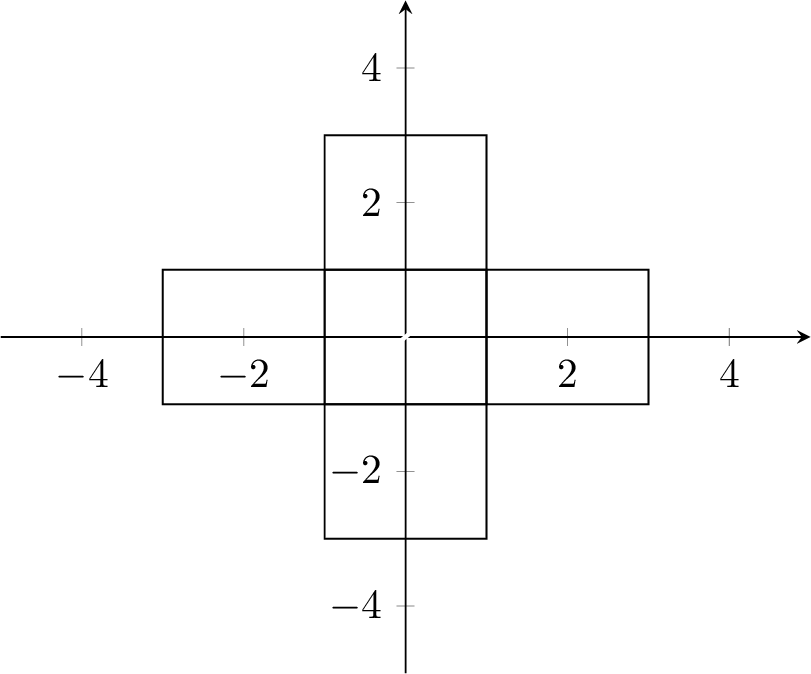
An equation for a straight line is plotted using the 'addplot' command, with white color and a line width of 1, covering the domain from -5 to 5.
Several rectangles are drawn using the 'draw' command. Each rectangle is defined by its lower-left and upper-right coordinates in the format of (x1,y1) rectangle (x2,y2). The coordinates are relative to the axes and are placed at (-1,-1) to (1,1), (1,-1) to (3,1), (-1,-1) to (-3,1), (-1,1) to (1,3), and (-1,-1) to (1,-3).
Finally, the TikZ environment is closed with the 'end' command. The output of the code is a simple graph with a straight line and five rectangles.
Keywords
pgfplots, axis, plot, domain, rectangle, draw.
Source Code
\documentclass{standalone}
\usepackage{pgfplots}
\pgfplotsset{compat=newest}

\begin{document}

\begin{tikzpicture}
\begin{axis}[
    axis lines=middle
]
\addplot [white, line width = 1, smooth, domain=-5:5] {x};
\draw (-1,-1) rectangle (1,1);
\draw (1,-1) rectangle (3,1);
\draw (-1,-1) rectangle (-3,1);
\draw (-1,1) rectangle (1,3);
\draw (-1,-1) rectangle (1,-3);
\end{axis}
\end{tikzpicture}


\end{document}