Description
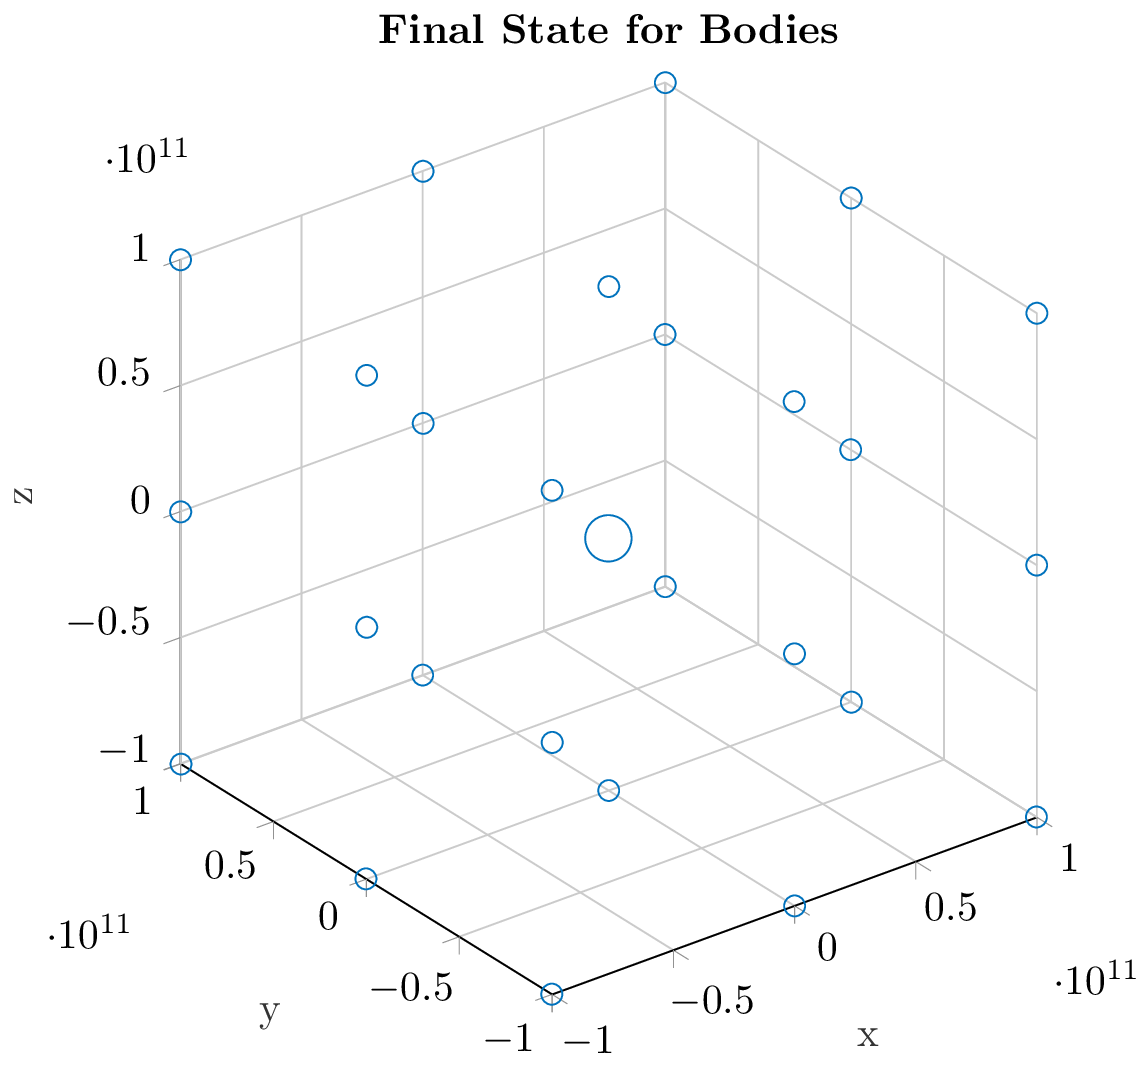
The code is a TikZ picture environment that plots a 3D scatter plot using the pgfplots package. The plot represents the final state for a collection of bodies in 3D space, where each point in the plot represents a body. The coordinates of the points are given in the input data as (x,y,z) tuples, and the size of each point is determined by the size column in the input data.
The pgfplots settings are defined in the preamble, including the axis limits, grid settings, and legend style. The compat=newest option ensures that the latest version of pgfplots is used. The tikzlibrary and pgfplotslibrary packages are loaded for additional plot customization options.
The axis environment is used to define the plot axis properties, such as the axis labels, tick marks, and the viewing angle. The scatter plot type is used to plot the data as individual points, and the mark option is set to o to plot the points as circles. The color of the points is set to a shade of blue using the mycolor1 definition. The visualization depends on and scatter/@pre marker code options are used to scale the size of the markers based on the size column of the input data.
Overall, the code generates a 3D scatter plot representing the final state of a set of bodies in space, with each point representing a body and the size of each point representing some characteristic of the body.
Keywords
triangle, circle, node, edge, path, fill, draw, coordinate, above, below, left, right, midway, bend, to, rectangle, rounded corners, minimum size, inner sep, outer sep, anchor, text, font, size, color.
Source Code
\documentclass{standalone}

  \usepackage{pgfplots}
  \pgfplotsset{compat=newest}
  %% the following commands are needed for some matlab2tikz features
  \usetikzlibrary{plotmarks}
  \usetikzlibrary{arrows.meta}
  \usepgfplotslibrary{patchplots}
  \usepackage{grffile}
  \usepackage{amsmath}

  %% you may also want the following commands
  %\pgfplotsset{plot coordinates/math parser=false}
  %\newlength\figureheight
  %\newlength\figurewidth
\definecolor{mycolor1}{rgb}{0.00000,0.44700,0.74100}
\begin{document}
\begin{tikzpicture}

\begin{axis}[%
width=2.856in,
height=3.04in,
at={(0.532in,0.41in)},
scale only axis,
xmin=-100000000000,
xmax=100000000000,
tick align=outside,
xlabel style={font=\color{white!15!black}},
xlabel={x},
ymin=-100099789790,
ymax=100221383780,
ylabel style={font=\color{white!15!black}},
ylabel={y},
zmin=-100000000000,
zmax=100000000000,
zlabel style={font=\color{white!15!black}},
zlabel={z},
view={-37.5}{30},
axis background/.style={fill=white},
title style={font=\bfseries},
title={Final State for Bodies},
axis x line*=bottom,
axis y line*=left,
axis z line*=left,
xmajorgrids,
ymajorgrids,
zmajorgrids,
legend style={at={(1.03,1)}, anchor=north west, legend cell align=left, align=left, draw=white!15!black}
]
\addplot3[scatter, only marks, mark=o, color=mycolor1, mark options={}, scatter/use mapped color=mycolor1, visualization depends on={\thisrow{size} \as \perpointmarksize}, scatter/@pre marker code/.append style={/tikz/mark size=\perpointmarksize}] table[row sep=crcr]{%
x	y	z	size\\
-99997680035	-99855857673	-99997638019	2.53722289127305\\
-99995820981	-100078368310	-58635.022346	2.53722289127305\\
-99997695110	-100009034110	99997623812	2.51246890528022\\
-99995843643	226503275.05	-99995779505	2.52487623459052\\
-99988412223	-179555862.51	-32819.532687	2.52487623459052\\
-99995844851	-181718398.34	99995769983	2.5\\
-99997702127	99812198113	-99997628815	2.51246890528022\\
-99995834363	100002281340	28394.932892	2.53722289127305\\
-99997688220	100066622950	99997631716	2.52487623459052\\
-38982.610169	-100099789790	-99995805526	2.52487623459052\\
-48117.853869	-100038411320	-32185.880326	2.52487623459052\\
24109.366574	-99841676469	99995788472	2.51246890528022\\
11726.151807	12985306.256	-99988385554	2.51246890528022\\
-28519.319386	195477542.09	-15684.045798	5.59016994374947\\
27742.353864	-21179197.996	99988377381	2.51246890528022\\
8934.5609253	100197328670	-99995811305	2.51246890528022\\
-45136.404472	99925853996	17134.979224	2.51246890528022\\
-37145.860615	100011674450	99995806820	2.52487623459052\\
99997669088	-99781825884	-99997684828	2.52487623459052\\
99995807964	-99925688910	4436.776345	2.51246890528022\\
99997695013	-100027683570	99997681472	2.52487623459052\\
99995838034	-135798071.12	-99995820437	2.53722289127305\\
99988403193	228679228.99	-16782.459343	2.51246890528022\\
99995842575	-30315078.36	99995814229	2.52487623459052\\
99997700542	100089944940	-99997679122	2.52487623459052\\
99995828402	100221383780	-17685.690958	2.52487623459052\\
99997679305	100068347900	99997674675	2.51246890528022\\
};
\end{axis}
\end{tikzpicture}
\end{document}