Description
The code is a LaTeX document that uses the standalone document class and loads the tikz package to create a block diagram for a control system.
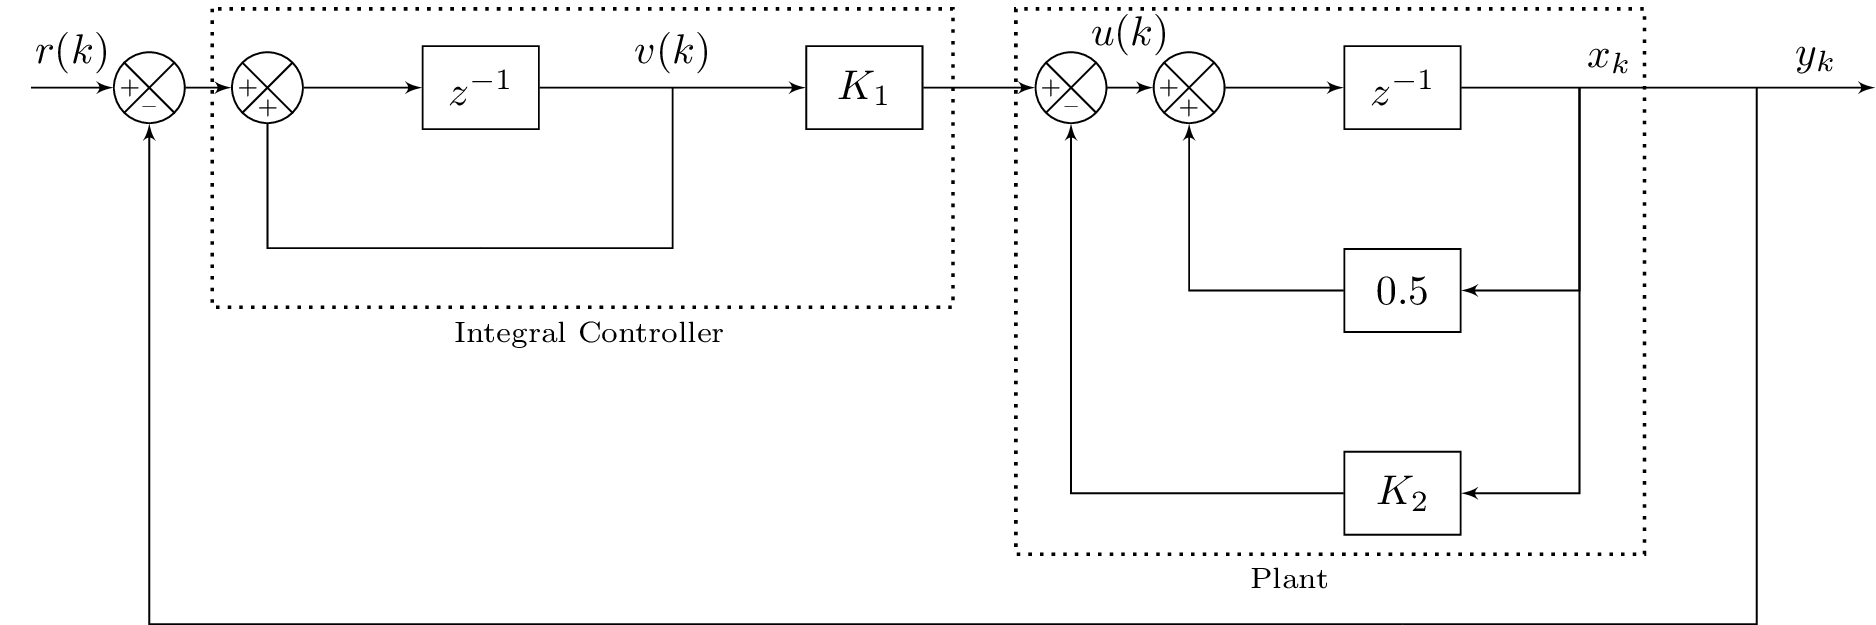
The diagram consists of two main parts: an integral controller and a plant. The integral controller includes a summing junction, a delay block, and a gain block. The plant includes two summing junctions, two delay blocks, a constant block, and a gain block. The input signal is fed into the integral controller, which generates a control signal that is fed into the plant. The plant generates an output signal that is the result of the control signal acting on the plant.
The diagram is created using TikZ's positioning library to arrange the various blocks and nodes in a visually appealing manner. The code defines several custom styles for the various blocks and junctions, and also defines a custom style for adding text labels to the various points in the diagram. Finally, the code uses TikZ's decorations library to add braces and labels to some of the blocks in the diagram.
Keywords
tikz, node, path, draw, rectangle, coordinate, left, right, below, above, arrow, edge, text, fill, black.
Source Code
\documentclass[%
% border=1pt
border={-25pt 0pt 0pt 0pt} % left bottom right top
]{standalone}
\usepackage{tikz}
\usepackage{amsmath}
\usetikzlibrary{positioning}
\usetikzlibrary{shapes,arrows,calc}
\usetikzlibrary{decorations.text}
\usetikzlibrary{decorations.pathreplacing}
\tikzset{add/.style n args={4}{
		minimum width=6mm,
		path picture={
			\draw[black]
			(path picture bounding box.south east) -- (path picture bounding box.north west)
			(path picture bounding box.south west) -- (path picture bounding box.north east);
			\node at ($(path picture bounding box.south)+(0,0.13)$)     {\tiny #1};
			\node at ($(path picture bounding box.west)+(0.13,0)$)      {\tiny #2};
			\node at ($(path picture bounding box.north)+(0,-0.13)$)        {\tiny #3};
			\node at ($(path picture bounding box.east)+(-0.13,0)$)     {\tiny #4};
		}
	}
}
\begin{document}

%\begin{figure}
%\centering
	%\tikzstyle{block} = [draw, fill=blue!20, rectangle, minimum height=3em, minimum width=4em]
	\tikzstyle{block} = [draw, rectangle, minimum height=2em, minimum width=0.5em]
	\tikzstyle{controller} = [draw, fill=red!20, rectangle, minimum height=2em, minimum width=1em]
	\tikzstyle{sum} = [draw, fill=blue!20, circle, node distance=1cm]
	\tikzstyle{input} = [coordinate]
	\tikzstyle{output} = [coordinate]
	\tikzstyle{sampleSP} = [coordinate]
	\tikzstyle{sampleEP} = [coordinate]
	\tikzstyle{otherPoint} = [coordinate]
	\tikzset{
		position label/.style={
			below = 3pt,
			text height = 1.5ex,
			text depth = 1ex
		},
		brace/.style={
			decoration={brace, mirror},
			decorate
		}
	}
	\begin{tikzpicture}[auto, >=latex']

	%% Integral Controller
	% Nodes and Blocks
	\node [input] (input) {};
	%\node [sum, right = 1cm of input] (sum) {};
	\node[draw,circle,add={--}{+}{}{},right of= input](sum){};
	\node[draw,circle,add={+}{+}{}{},right of= sum](sumint){};
	\node [block, right = 1cm of sumint,text width=0.75cm,align=center] (delay1) {$z^{-1}$};

	% feedback points
	\node [otherPoint,right = 1.125 cm of delay1] (vkbelow) {}; %{$\frac{1}{Ts+1}$};
	\node [otherPoint, below = 1cm of delay1] (m1) {};

	% Gain Blocks
	\node [block, right = 2.25cm of delay1,text width=0.75cm,align=center] (gainK1) {$K_1$};

	% Declarations for integral controller
	\draw[thick,dotted]     ($(sumint.north west)+(-0.25,0.45)$) rectangle ($(gainK1.south east)+(0.25,-1.5)$);
	\node [below right=1.5cm and -0.85cm of delay1] {\scriptsize{Integral Controller}}; (text1)
	%\draw [brace,decoration={raise=2ex}] (sumint.south west) -- node [position label,yshift=-3ex] {$G(s)$} (gainK1.south east);

	%% Plant
	\node [otherPoint, right = 0.25cm of gainK1] (sumP1Space) {};
	% Summers
	\node [draw,circle,add={--}{+}{}{}, right of= sumP1Space] (sumP1) {};
	\node [draw,circle,add={+}{+}{}{}, right of= sumP1] (sumP2) {};
	% Blocks
	\node [block, right = 1cm of sumP2,text width=0.75cm,align=center] (delay2) {$z^{-1}$};
	\node [block, below = 1cm of delay2,text width=0.75cm,align=center] (constant05) {$0.5$};
	\node [block, below = 1cm of constant05,text width=0.75cm,align=center] (gainK2) {$K_2$};

	%Output Points
	\node [otherPoint, right = 1cm of delay2] (xk) {};

	\node [otherPoint, right = 1.5cm of xk] (yk) {};
	\node [output, right of = yk] (output) {};%{$y(k)$};

	\node [output, below = 0.75cm of gainK2] (m2) {};

	% Declarations for plant controller
	\draw[thick,dotted]     ($(sumP1.north west)+(-0.25,0.45)$) rectangle ($(xk.south east)+(0.55,-3.95)$);
	\node [below left=0.15cm and 0.001cm of gainK2] {\scriptsize{Plant}}; (text2)

	% Arrows for Integral Controller
	\draw [draw,->] (input) -- node {$r(k)$} (sum);
	\draw [draw,->] (sum) -- node {} (sumint);
	\draw [draw,->] (delay1) -- node {$v(k)$} (gainK1);
	\draw [draw,->] (sumint) -- node {} (delay1);

	% Feedback for integral controller
	\draw [-] (vkbelow) |- (m1) {} ;
	\draw [-] (m1) -| (sumint) {} ;


	% Arrows for Plant
	\draw [draw,->] (gainK1) -- node {} (sumP1);

	\draw [draw,->] (sumP1) -- node[above=0.15] {$u(k)$} (sumP2);
	\draw [draw,->] (sumP2) -- node {} (delay2);

	%Feedback to Summers in Plant
	\draw [->] (constant05) -| (sumP2) {} ;
	\draw [->] (gainK2) -| (sumP1) {} ;

	% Feedback for plant and finishing up connections
	\draw [->] (xk) |- (constant05) {} ;
	\draw [->] (xk) |- (gainK2) {} ;
	\draw [draw,-] (delay2) -- node {$x_k$} (yk);
	\draw [draw,->] (yk) -- node {$y_k$} (output);
	\draw [-] (yk) |- (m2) {} ;
	\draw [->] (m2) -| (sum) {} ;

	\end{tikzpicture}
%\end{figure}
\end{document}