Description
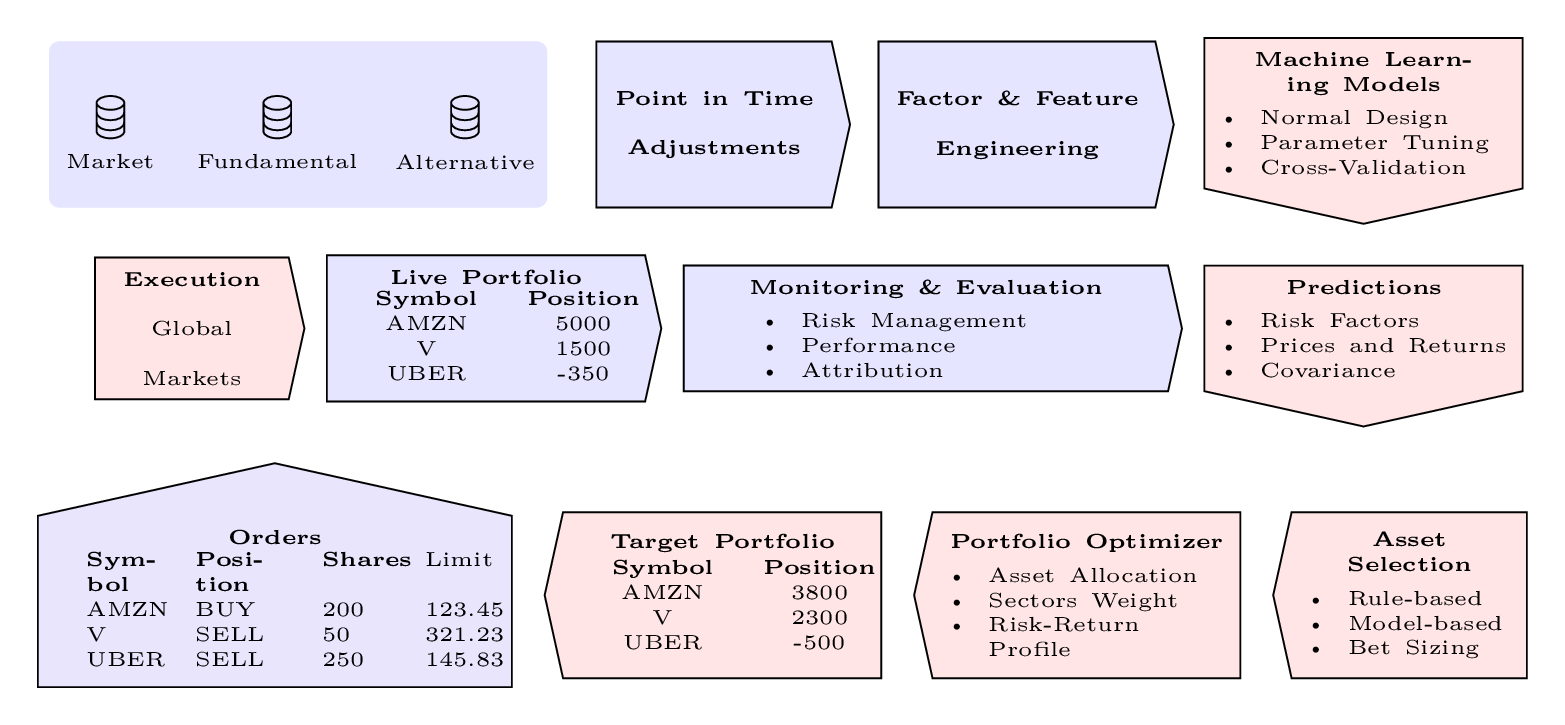
The code is a LaTeX document that generates a diagram using the TikZ package. The diagram represents a high-level overview of the process of building a machine learning model for algorithmic trading.
The diagram consists of several rectangular nodes and signal nodes connected by arrows, representing the flow of information and processes. The rectangular nodes represent the data sources, which are labeled as "Market", "Fundamental", and "Alternative". These nodes are connected to a series of signal nodes representing "Point in Time Adjustments" and "Factor & Feature Engineering". The final signal node at the bottom of the diagram represents the "Machine Learning Models" and is connected to another signal node representing the "Predictions". The final rectangular node at the end of the diagram represents the "Monitoring & Evaluation" of the model.
The code defines several custom styles for the TikZ nodes, including a database style for the data source nodes and a signal style for the signal nodes. The code also defines several small tables, which are saved in boxes and used in the data source nodes to represent position information and order information.
Keywords
tikzpicture, node, draw, rectangle, fill, text, above, right, below, left.
Source Code
% Author David Li
% Inspired by Machine Learning for Algorithmic Trading Second Edition
% see https://github.com/PacktPublishing/Machine-Learning-for-Algorithmic-Trading-Second-Edition
% References Shapes from
% http://tug.ctan.org/info/visualtikz/VisualTikZ.pdf
\documentclass[tikz,border=3.14mm]{standalone}
\usepackage{enumitem}
\usetikzlibrary{shapes.geometric}
\usetikzlibrary{shapes.symbols}
\tikzset{database/.style={cylinder,aspect=0.5,draw,rotate=90,path picture={
\draw (path picture bounding box.160) to[out=180,in=180] (path picture bounding
box.20);
\draw (path picture bounding box.200) to[out=180,in=180] (path picture bounding
box.340);
}}}

\newsavebox{\tptable}
\sbox{\tptable}{\tiny{
\begin{tabular}{c c }
  \textbf{Symbol} & \textbf{Position} \\
  AMZN & 3800 \\
  V & 2300 \\
  UBER & -500
  \end{tabular}
 }}

\newsavebox{\lptable}
\sbox{\lptable}{\tiny{
\begin{tabular}{c c }
  \textbf{Symbol} & \textbf{Position} \\
  AMZN & 5000 \\
  V & 1500 \\
  UBER & -350
  \end{tabular}
 }}

\newsavebox{\orderstable}
\sbox{\orderstable}{\tiny{
\begin{tabular}{p{0.5cm}p{0.65cm}p{0.45cm}p{0.5cm}}
  \textbf{Symbol} & \textbf{Position} & \textbf{Shares} & {Limit} \\
  AMZN & BUY & 200 & 123.45 \\
  V & SELL & 50 & 321.23 \\
  UBER & SELL & 250 & 145.83
  \end{tabular}
 }}

\begin{document}
\setlist[itemize]{noitemsep, topsep=2pt}
\begin{tikzpicture}
% data sources
\node[rectangle, rounded corners=0.25em,draw=none, minimum width=12em, minimum height=4em, fill=blue!10] (data_source) {};
\node[database, label={[label distance=0cm]180:\tiny{Market}}] (market) at ([xshift=1.5em] data_source.west) {};
\node[database, label={[label distance=0cm]180:\tiny{Fundamental}}] (fundamental) at ([xshift=-0.5em] data_source) {};
\node[database, label={[label distance=0cm]180:\tiny{Alternative}}] (alternative) at ([xshift=-2.0em] data_source.east) {};

\node[
    signal,signal to = east,
    fill=blue!10,draw=black,
    signal pointer angle=155,
    text width=5em,align=center,
    font=\color{black}\bfseries,
    minimum height=4em
    ] (pit_adj) at ([xshift=4.0em] data_source.east) {\tiny{Point in Time Adjustments}};

\node[
    signal,signal to = east,
    fill=blue!10,draw=black,
    signal pointer angle=155,
    text width=6em,align=center,
    font=\color{black}\bfseries,
    minimum height=4em
    ] (ffe) at ([xshift=4.0em] pit_adj.east) {\tiny{Factor \& Feature Engineering}};

\node[
    signal,signal to = south,
    signal pointer angle=155,
    fill=red!10,draw=black,
    text width=7em,align=center,
    font=\color{black},
    minimum height=2em
    ] (mml) at ([xshift=5.0em, yshift=-1.75em] ffe.north east) {
    \tiny{\textbf{Machine Learning Models}}
    \tiny{{\begin{itemize}[leftmargin=*]
        \item Normal Design
        \item Parameter Tuning
        \item Cross-Validation
    \end{itemize}}}};

\node[
    signal,signal to = south,
    signal pointer angle=155,
    fill=red!10,draw=black,
    text width=7em,align=center,
    font=\color{black},
    minimum height=2em
    ] (pred) at ([ yshift=-2.5em] mml.south) {
    \tiny{\textbf{Predictions}}
    \tiny{{\begin{itemize}[leftmargin=*]
        \item Risk Factors
        \item Prices and Returns
        \item Covariance
    \end{itemize}}}};

\node[
    signal,signal to = east,
    signal pointer angle=155,
    fill=blue!10,draw=black,
    text width=11em,align=center,
    font=\color{black},
    minimum height=2em,
    anchor=east
    ] (monitor_and_eval) at ([xshift=-0.5em] pred.west) {
    \tiny{\textbf{Monitoring \& Evaluation}}
    \tiny{{\begin{itemize}[]
        \item Risk Management
        \item Performance
        \item Attribution
    \end{itemize}}}};

\node[
    signal,signal to = east,
    signal pointer angle=155,
    fill=blue!10,draw=black,
    text width=7em,align=center,
    font=\color{black},
    minimum height=2em,
    anchor=east
    ] (live_portfolio) at ([xshift=-0.5em] monitor_and_eval.west) {
    \tiny{\textbf{Live Portfolio}}
    {\usebox{\lptable}}
    };

\node[
    signal,signal to = east,
    signal pointer angle=155,
    fill=red!10,draw=black,
    text width=4em,align=center,
    font=\color{black},
    minimum height=2em,
    anchor=east
    ] (execution) at ([xshift=-0.5em] live_portfolio.west) {
    \tiny{\textbf{Execution}}
    \tiny{Global Markets}
    };

\node[
    signal,signal to = north,
    signal pointer angle=155,
    fill=red!10!blue!10,draw=black,
    text width=10.75em,align=center,
    font=\color{black},
    minimum height=2em,
    anchor=north
    ] (orders) at ([xshift=2em, yshift=-1.5em] execution.south) {
    \tiny{\textbf{Orders}}
    \usebox{\orderstable}
    };
\node[
    signal,signal to = west,
    signal pointer angle=155,
    fill=red!10,draw=black,
    text width=7em,align=center,
    font=\color{black},
    minimum height=4em,
    anchor=west
    ] (target_portfolio) at ([xshift=0.75em, yshift=0.15em] orders.east) {
    \tiny{\textbf{Target Portfolio}}
    \usebox{\tptable}
    };
\node[
    signal,signal to = west,
    signal pointer angle=155,
    fill=red!10,draw=black,
    text width=6.75em,align=center,
    font=\color{black},
    minimum height=4em,
    anchor=west
    ] (portfolio_optimizer) at ([xshift=0.75em, yshift=-0em] target_portfolio.east) {
    \tiny{\textbf{Portfolio Optimizer}}
    \tiny{{\begin{itemize}[leftmargin=*]
        \item Asset Allocation
        \item Sectors Weight
        \item Risk-Return Profile
    \end{itemize}}}
    };
\node[
    signal,signal to = west,
    signal pointer angle=155,
    fill=red!10,draw=black,
    text width=5em,align=center,
    font=\color{black},
    minimum height=4em,
    anchor=west
    ] (asset_selection) at ([xshift=0.75em, yshift=-0em] portfolio_optimizer.east) {
    \tiny{\textbf{Asset Selection}}
    \tiny{{\begin{itemize}[leftmargin=*]
        \item Rule-based
        \item Model-based
        \item Bet Sizing
    \end{itemize}}}
    };
\end{tikzpicture}
\end{document}