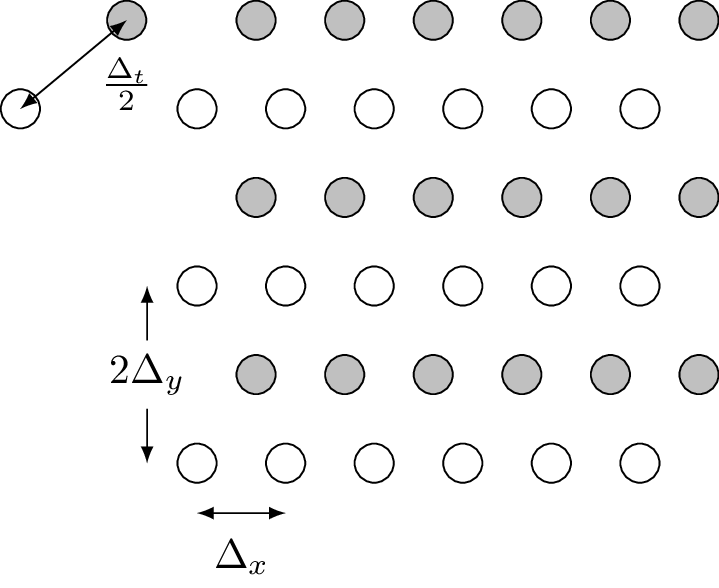
Description
This is a LaTeX code for drawing a TikZ picture. The code defines several styles for nodes with different shapes and fills, and sets the distance between nodes. Then, it creates a grid of nodes with alternating fills, based on the specified number of vertices. Finally, it draws arrows with labels between some of the nodes using relative positioning. Additionally, it creates two extra nodes and draws an arrow with a label between them.
Keywords
latex, tikz, positioning, calc, node, distance, style, circle, draw, fill, minimum, size, foreach, ifnum, ifresult, node, at, west, east, south, north, above, below, left, right, latex-latex, label, midway.
Source Code
\documentclass{standalone}
\usepackage{tikz}
\usetikzlibrary{positioning, calc}
\begin{document}
\begin{tikzpicture}[align=center,node distance=0.5cm]
\tikzset{
darkstyle/.style={circle,draw,fill=gray!40,minimum size=20},
filled/.style={circle,draw,fill=gray!60, minimum size=5},
white/.style={circle,draw, minimum size=5,,xshift=-0.5cm},
}
% number of vertices
\def \n {5}
\def \xshift{2cm}
\foreach \x in {0,...,\n}
{   \foreach \y in {0,...,\n}
    {   \pgfmathtruncatemacro{\nodelabel}{\x+\y*6+1}
        %\pgfmathtruncatemacro{\row}{Mod(\x,2)}
        \pgfmathparse{Mod(\y,2)==0?1:0}
        \ifnum\pgfmathresult>0
            \node[filled] (\nodelabel) at (0.75*\x,-0.75*\y) {};
        \else
            \node[white] (\nodelabel) at (0.75*\x,-0.75*\y) {};
        \fi
    }
}
% \draw[latex-latex] (19.west) -- ++ (25.west) node[midway]{label};
 \draw [latex-latex] ($(19.west) + (-0.25cm, 0)$) -- ($(31.west) + (-0.25cm, 0)$) node[midway, fill=white]{$2\Delta_y$};
  \draw [latex-latex] ($(31.south) + (0cm, -0.25cm)$) -- ($(32.south) + (0cm, -0.25cm)$) node[midway, below, yshift=-0.1cm, fill=white]{$\Delta_x$};
  % Add nodes for ts
  % \draw[latex-latex] ($(7.south) + (-0.25cm, -0.25cm)$) -- ($(1.south) + (-0.25cm, -0.25cm)$) node[midway, below, yshift=-0.1cm, fill=white]{$\Delta_x$};

  \node[filled, left = of 1, xshift =-0.25cm] (aa) {};
  \node[white, left = of 7, xshift =-0.15cm] (ab) {};
\draw [latex-latex] ($(ab) + (0cm, 0cm)$) -- ($(aa) + (0cm, 0cm)$) node[below, yshift=-0.2cm]{$\frac{\Delta_t}{2}$};
\end{tikzpicture}
\end{document}