Description
The code defines a Gantt chart using the pgfgantt package. The Gantt chart visualizes a schedule of tasks that run on a single CPU, with some tasks requiring I/O and others not. The chart is defined in a ganttchart environment, with various options set for the appearance of the chart. The chart is divided into units of 0.35cm for the x-axis and 1.4cm for the y-axis. The chart has vertical gray lines every unit and bars are drawn inline with no group borders. The y-axis titles are set to a height of 0.5cm.
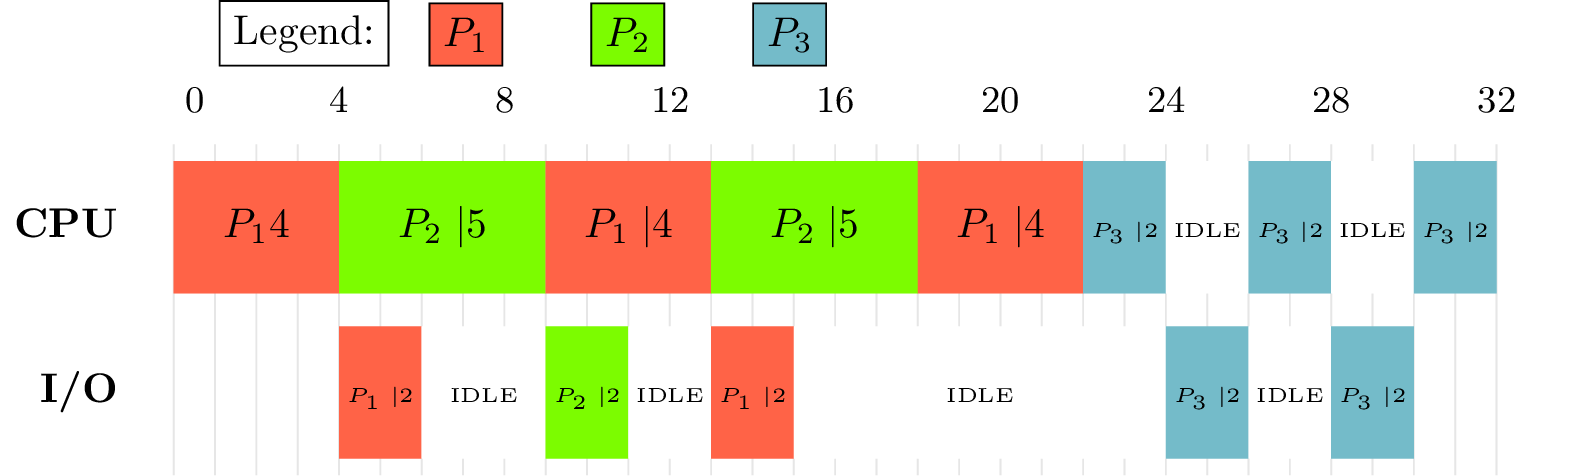
The Gantt chart displays a total of 32 units of time, with the time intervals labeled on the top of the chart. There are two groups of tasks displayed: CPU and I/O. The CPU tasks are colored in red, green, and blue, and the I/O tasks are colored in red and green. Some tasks are followed by a number in parentheses that indicates the time duration of the task.
There are three processes represented on the chart: , , and . Each process is represented by a series of bars with different colors representing the different phases of the process. The chart indicates the times when the processes are executing, waiting for I/O, or in an idle state. There are also three instances of a milestone represented on the chart with a small dot and a label on the left.
Keywords
tikz, documentclass, usepackage, begin, center, tikzpicture, draw, node, circle, fill, edge, path, right, left, above, below, label, style
Source Code
\documentclass{standalone}

\usepackage{pgfgantt}
\definecolor{blue}{HTML}{74BBC9}
\definecolor{yellow}{HTML}{F7E967}
\definecolor{green}{HTML}{7CFC00}	% lawn green
\definecolor{red}{HTML}{FF6347}		% tomato
\begin{document}
%\begin{figure}
\begin{ganttchart}[
		x unit=0.35cm,
		y unit chart=1.4cm,
		canvas/.style={draw=none,fill=none}, % remove canvas borders, etc
		vgrid={*1{draw=black!12}},           % vertical gray lines every unit
		inline,                              % draw bars inline
		group/.style={draw=none,fill=none},  % remove group borders, etc
		bar top shift=0.1,                   % give bar 10% padding top/bottom
		bar height=0.8,                      % bar size 80% of vertical space
		y unit title=0.5cm,                  % crop titles a little smaller
		title/.style={draw=none,fill=none},  % remove title borders, etc
		include title in canvas=false,        % no vertical grid in title
		milestone inline label node/.append style={left=5mm}	% see if I can include milestones
	]{-1}{32}

	\gantttitle{0}{3}
	\gantttitle{4}{4}
	\gantttitle{8}{4}
	\gantttitle{12}{4}
	\gantttitle{16}{4}
	\gantttitle{20}{4}
	\gantttitle{24}{4}
	\gantttitle{28}{4}
	\gantttitle{32}{4}\\

	% Note that 2 units = 4 in the diagram
	\ganttgroup[inline=false]{CPU}{0}{1}
	\ganttbar[bar/.style={fill=red}]{$P_1$4}{0}{3}
	\ganttbar[bar/.style={fill=green}]{$P_2\mid$5}{4}{8}
	\ganttbar[bar/.style={fill=red}]{$P_1\mid$4}{9}{12}
 	\ganttbar[bar/.style={fill=green}]{$P_2\mid$5}{13}{17}
 	\ganttbar[bar/.style={fill=red}]{$P_1\mid$4}{18}{21}
 	\ganttbar[bar/.style={fill=blue}]{\tiny{$P_3\mid$2}}{22}{23}
 	\ganttbar[bar/.style={fill=white}]{\tiny {IDLE}}{24}{25}
 	\ganttbar[bar/.style={fill=blue}]{\tiny{$P_3\mid$2}}{26}{27}
  	\ganttbar[bar/.style={fill=white}]{\tiny {IDLE}}{28}{29}
	\ganttbar[bar/.style={fill=blue}]{\tiny{$P_3\mid$2}}{30}{31}
 	\\
%	\ganttmilestone{$T_4-16 =8$}{18}

	\ganttgroup[inline=false]{I/O}{0}{1}
	\ganttbar[bar/.style={fill=red}]{\tiny{$P_1\mid$2}}{4}{5}
	\ganttbar[bar/.style={fill=white}]{\tiny{IDLE}}{6}{8}
	\ganttbar[bar/.style={fill=green}]{\tiny{$P_2\mid$2}}{9}{10}
	\ganttbar[bar/.style={fill=white}]{\tiny{IDLE}}{11}{12}
	\ganttbar[bar/.style={fill=red}]{\tiny{$P_1\mid$2}}{13}{14}
	\ganttbar[bar/.style={fill=white}]{\tiny{IDLE}}{15}{23}
	\ganttbar[bar/.style={fill=blue}]{\tiny{$P_3\mid$2}}{24}{25}
	\ganttbar[bar/.style={fill=white}]{\tiny{IDLE}}{26}{27}
	\ganttbar[bar/.style={fill=blue}]{\tiny{$P_3\mid$2}}{28}{29}
	%\ganttbar[bar/.style={fill=blue}]{2}{2}{5}
	%\ganttbar[bar/.style={fill=yellow}]{6}{6}{8}
	%\ganttbar[bar/.style={fill=white}]{IDLE}{25}{29}
%	\ganttgroup[inline=false]{$T_{2,1}$}{0}{1}
%	\ganttbar[bar/.style={fill=blue}]{1}{0}{1}
%	\ganttbar[bar/.style={fill=yellow}]{7}{9}{11} \\

%	\ganttgroup[inline=false]{$T_{3,1}$}{0}{1}
%	\ganttbar[bar/.style={fill=yellow}]{4}{0}{2}

\node (a) [fill=blue,draw,anchor=south] at (current bounding box.north){$P_3$};
\node (b) [fill=green,draw,anchor=south] at ([xshift=-30pt]a.south west){$P_2$};
\node (c) [fill=red,draw,anchor=south] at ([xshift=-30pt]b.south west){$P_1$};
\node (legend) [fill=white,draw,anchor=south] at ([xshift=-30pt]c.south west){Legend:};
%\node[fill=purple,draw,anchor=west] at ([yshift=-20pt]d.south west){Box North East};
\end{ganttchart}
%\caption{A flexible job shop schedule}
%\label{fig:schedule}
%\end{figure}

\end{document}