Description
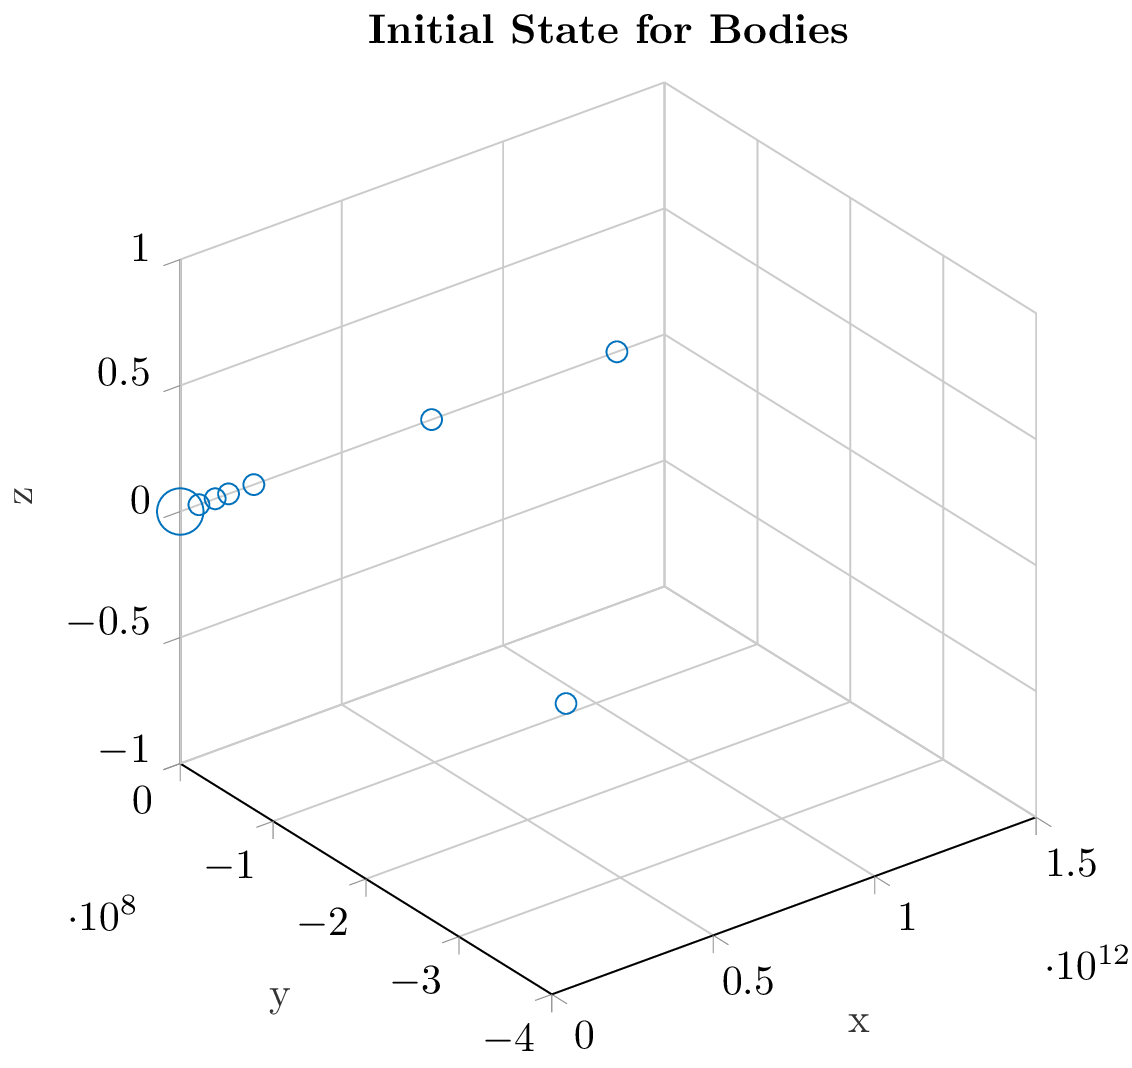
The code is a LaTeX document that includes a TikZ picture of a 3D scatter plot created using the pgfplots package. The plot displays the initial state for bodies in space and shows the coordinates of various points in 3D space. The plot uses different colors and marker sizes for each point, and the legend describes the point size in the plot. The code also includes various packages and options to customize the appearance of the plot.
Keywords
pgfplots, tikzpicture, axis, scatter, table, visualization, legend, xlabel, ylabel, zlabel, view, only marks, mark options.
Source Code
\documentclass{standalone}

  \usepackage{pgfplots}
  \pgfplotsset{compat=newest}
  %% the following commands are needed for some matlab2tikz features
  \usetikzlibrary{plotmarks}
  \usetikzlibrary{arrows.meta}
  \usepgfplotslibrary{patchplots}
  \usepackage{grffile}
  \usepackage{amsmath}

  %% you may also want the following commands
  %\pgfplotsset{plot coordinates/math parser=false}
  %\newlength\figureheight
  %\newlength\figurewidth
\definecolor{mycolor1}{rgb}{0.00000,0.44700,0.74100}
\begin{document}

% This file was created by matlab2tikz.
%
%The latest updates can be retrieved from
%  http://www.mathworks.com/matlabcentral/fileexchange/22022-matlab2tikz-matlab2tikz
%where you can also make suggestions and rate matlab2tikz.
%
\definecolor{mycolor1}{rgb}{0.00000,0.44700,0.74100}%
%
\begin{tikzpicture}

\begin{axis}[%
width=2.853in,
height=3.04in,
at={(0.528in,0.41in)},
scale only axis,
xmin=0,
xmax=1500000000000,
tick align=outside,
xlabel style={font=\color{white!15!black}},
xlabel={x},
ymin=-400000000,
ymax=0,
ylabel style={font=\color{white!15!black}},
ylabel={y},
zmin=-1,
zmax=1,
zlabel style={font=\color{white!15!black}},
zlabel={z},
view={-37.5}{30},
axis background/.style={fill=white},
title style={font=\bfseries},
title={Initial State for Bodies},
axis x line*=bottom,
axis y line*=left,
axis z line*=left,
xmajorgrids,
ymajorgrids,
zmajorgrids,
legend style={at={(1.03,1)}, anchor=north west, legend cell align=left, align=left, draw=white!15!black}
]
\addplot3[scatter, only marks, mark=o, color=mycolor1, mark options={}, scatter/use mapped color=mycolor1, visualization depends on={\thisrow{size} \as \perpointmarksize}, scatter/@pre marker code/.append style={/tikz/mark size=\perpointmarksize}] table[row sep=crcr]{%
x	y	z	size\\
0	0	0	5.59016994374947\\
57910000000	0	0	2.51246890528022\\
108200000000	0	0	2.51246890528022\\
149600000000	0	0	2.51246890528022\\
149600000000	-363300000	0	2.5\\
227920000000	0	0	2.51246890528022\\
778500000000	0	0	2.51246890528022\\
1352550000000	0	0	2.51246890528022\\
};

\end{axis}
\end{tikzpicture}%
\end{document}