Description
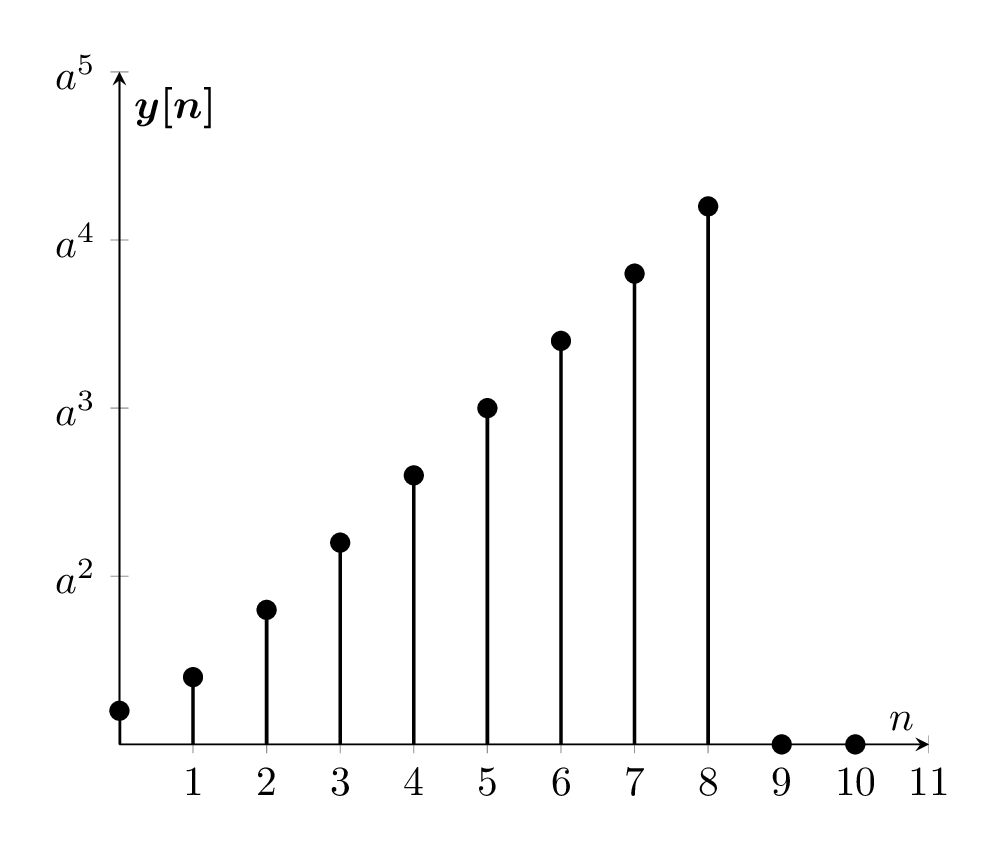
The code is a LaTeX document that generates a plot of a discrete signal. The signal is defined in the "data.dat" file, which is included in the document using the "filecontents" package. The signal is plotted using the "tikzpicture" environment and the "pgfplots" package. The signal is displayed as a stem plot using the "ycomb" option. The x-axis is labeled as "n" and the y-axis is labeled as "y[n]". The x-axis ticks are labeled with integers from 0 to 11, and the y-axis ticks are labeled with powers of "a" ranging from 0 to 10. The plot is displayed within the axis limits of 0 to 11 on the x-axis and 0 to 20 on the y-axis.
Keywords
tikz, pgfplots, filecontents, amsmath, ycomb, yticklabels, axis, xlabel, ylabel, xtick, xmin, xmax, ymin, ymax, mark options.
Source Code
\documentclass[border={10pt}]{standalone}
\usepackage{tikz,pgfplots,filecontents,amsmath}
\pgfplotsset{compat=1.5}

\begin{filecontents}{data.dat}
 n   yn
0    1
1    2
2    4
3    6
4    8
5    10
6    12
7    14
8    16
9    0
10   0
\end{filecontents}


\begin{document}
\begin{tikzpicture}
\begin{axis}
[%%%%%%%%%%%%%%%%%%%%%%%%%%%%%%%%%%%
    axis x line=middle,
    axis y line=middle,
    every axis x label={at={(current axis.right of origin)},anchor=north west},
    every axis y label={at={(current axis.above origin)},anchor= north west},
    every axis plot post/.style={mark options={fill=black}},
    xlabel={$n$},
    ylabel={$\boldsymbol{y[n]}$},
    xtick={0,1, ..., 11},
    xmax=11,
    yticklabels={
    	$a^0$,
    	$a^1$,
    	$a^2$,
    	$a^3$,
    	$a^4$,
    	$a^5$,
    	$a^6$,
    	$a^7$,
    	$a^8$,
    	$a^9$,
    	$a^10$
    },
    ymin=0,
    ymax=20,
]%%%%%%%%%%%%%%%%%%%%%%%%%%%%%%%%%%%
\addplot+[ycomb,black,thick] table [x={n}, y={yn}] {data.dat};
\end{axis}
\end{tikzpicture}

\end{document}